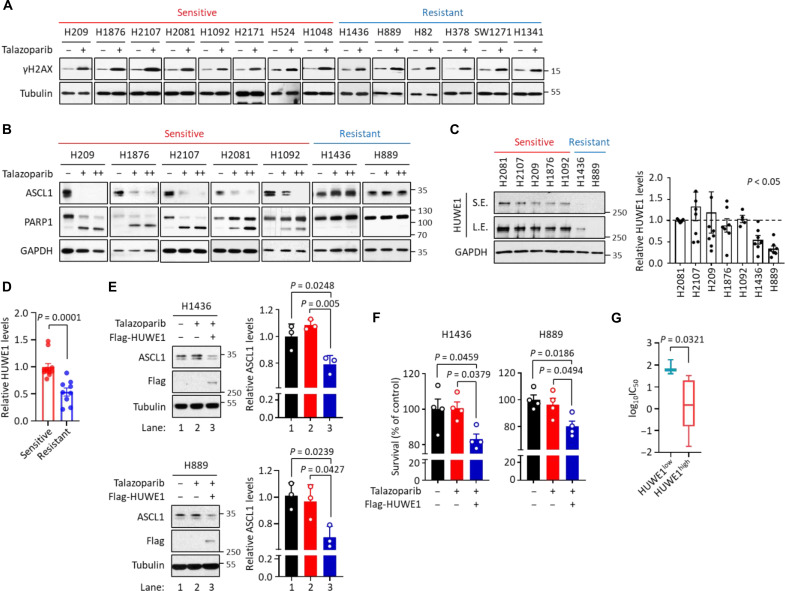
Fig. 5. Predictive biomarkers for PARPi-mediated cytotoxicity in SCLC.
(A) Extent of DNA damage in a panel of SCLC cells treated with talazoparib. Cells were treated with talazoparib (1 μM for 48 hours), and cell lysates were subjected to immunoblot analysis. Red: Sensitive SCLC cells; blue: resistant SCLC cells. (B) Levels of ASCL1 and cleaved PARP1 in ASCL1high SCLC cells treated with talazoparib. ASCL1high SCLC cells were treated with talazoparib [1 (+) and 10 (++) μM for 48 hours]. Cell lysates were subjected to immunoblot analysis. Red: Sensitive ASCL1high SCLC cells; blue: resistant ASCL1high SCLC cells. (C) Levels of HUWE1 in ASCL1high SCLC cells. Values were presented as means ± SD from (n = 3 to 7). Red: Sensitive ASCL1high SCLC cells; blue: resistant ASCL1high SCLC cells. S.E., short exposure; L.E., long exposure. (D) Relative levels of HUWE1 in ASCL1high SCLC cells from TMT-based proteomic datasets. The values of HUWE1 from the DMSO-treated samples in PARPi-sensitive and PARPi-resistant ASCL1high SCLC cells used in this study were collected, normalized, and presented as means ± SD. (E) HUWE1-mediated ASCL1 degradation in PARPi-resistant ASCL1high SCLC cells. H1436 and H889 cells expressing Flag-HUWE1 were treated with talazoparib (1 μM for 48 hours), and cell lysates were subjected to immunoblot analysis. Values were presented as means ± SD (n = 3). (F) HUWE1-mediated cell death in PARPi-resistant ASCL1high SCLC cells. H1436 and H889 cells expressing Flag-HUWE1 were treated with talazoparib (1 μM for 48 hours). Viability was measured and values were presented as means ± SEM (n = 4). (G) Boxplots showing the sensitivity of a panel of ASCL1high SCLC cells to PARPi. ASCL1high SCLC cells were grouped by the relative levels of HUWE1 expression, and the sensitivity was determined by the analysis of the GDSC database measuring IC50 against talazoparib treatment. Values were presented as means ± SD.

