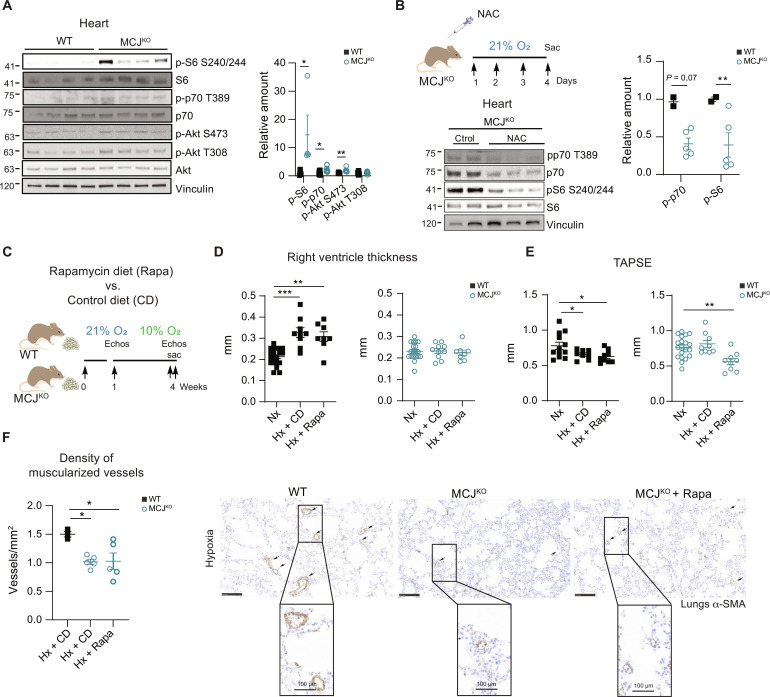
Fig. 4. MCJKO mice have higher baseline mTOR activation due to increased ROS production.
(A) Representative immunoblots of mTOR pathway activation in heart lysates from normoxic WT and MCJKO mice (n = 4 to 11). (B) Experimental protocol to assess the effect of ROS scavenging in MCJKO mice. Mice were intraperitoneally injected during four consecutive days with the ROS scavenger NAC and euthanized at day 5. Representative immunoblots of mTOR pathway activation in normoxic MCJKO mice injected with NAC or vehicle (control) (n = 2 to 5). (C) Experimental protocol for (D) to (F). WT and MCJKO mice were fed a control diet or a diet supplemented with rapamycin (mTOR inhibitor) for 1 week and then exposed to chronic (Hx; 10% O2). Diets were maintained until euthanasia. (D and E) Echocardiography assessment of RV hypertrophy (RV thickness) and function (TAPSE) in Nx or Hx mice fed with the control or rapamycin diet (n = 8 to 10, N = 2). (F) Muscularized vessel density in normoxic and hypoxic WT, MCJKO, and MCJKO lungs treated with rapamycin (n = 3 to 5, N = 2). Representative images show α-SMA immunostaining, with amplification of a remodeled vessel in hypoxia. Scale bars, 250 μm, 100 μm (vessel). n, number of biological samples; N, number of times that the experiment was repeated. All data are presented as means ± SEM. Statistical comparison by two-tailed Student’s t test [(A) and (C)] or one-way ANOVA with Tukey’s posttest [(E) to (G)]; NS, *P < 0.05, **P < 0.01, and ***P < 0.001. Panels (B) and (C) prepared using modified figures from Servier Medical Art (https://smart.servier.com/), licensed under a Creative Commons Attribution 3.0 unported license.

