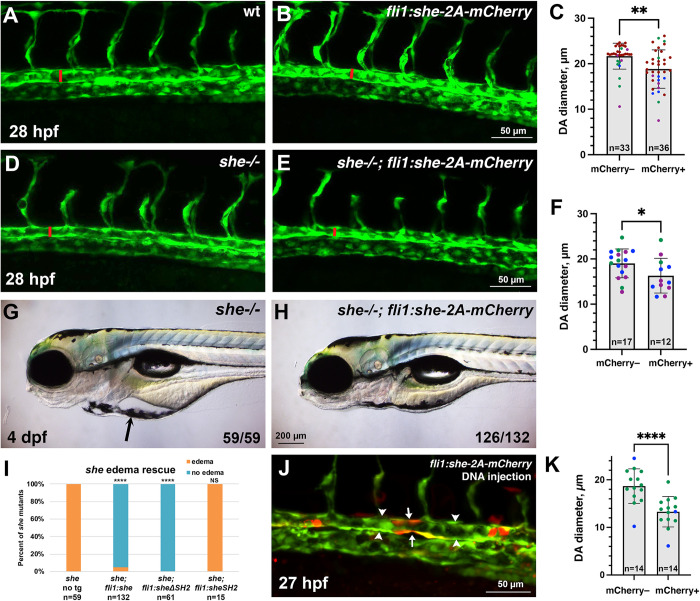
Fig 3. she overexpression in vasculature reduces the diameter of the dorsal aorta and rescues the she mutant phenotype.
(A-C) Quantification of trunk vasculature in wild-type and fli1:she-2A-mCherry embryos in kdrl:GFP background at 28 hpf. Confocal imaging of GFP expression in live embryos obtained from stable transgenic lines; the diameter of the DA is marked with red line. Note the reduction of DA diameter in fli1:she-2A-mCherry embryos compared to wild-type non-transgenic (mCherry-) siblings. Embryos were obtained by incross of she+/+ (referred to as wild-type); fli1:she-2A-mCherry+/- parents and separated based on mCherry expression. (D-F) Quantification of trunk vasculature in she-/- and she-/-; fli1:she-2A-mCherry embryos at 28 hpf. The diameter of the DA is marked with red line. Note that the DA diameter is reduced in she-/-; fli1:she-2A-mCherry embryos compared to she siblings without the transgene (mCherry-). Embryos were obtained by incross of she-/-; fli1:she-2A-mCherry+/- parents and separated based on mCherry expression. Note that wild-type and she-/- mCherry- embryos in (C and F) cannot be directly compared in this experiment because they came from different parents and are not siblings; embryos from different pairs can show significant variability in the DA diameter. (G,H) Pericardial edema in she-/- mutants (G) is rescued in she-/-; fli1:she-2A-mCherry embryos at 4 dpf. (I) Percentage of she mutant embryos showing pericardial edema at 4 dpf. Note that vascular endothelial expression of full length She (fli1:she-2A-mCherry) and the construct carrying a deletion of the SH2 domain in She protein (fli1:sheΔSH2-2A-mCherry) rescues the mutant phenotype, while overexpression of She construct with SH2 domain alone (fli1:sheSH2-2A-mCherry) fails to rescue the phenotype. ****p<0.0001, NS–not significant, Fisher’s exact test, compared to she no transgene embryos. (J) Injection of fli1:she-2A-mCherry DNA plasmid together with tol2 mRNA results in mosaic expression of she-2A-mCherry in endothelial cells. Note that mCherry positive segments of the DA (arrows) show reduced diameter compared to adjacent mCherry-negative segments (arrowheads). (K) Quantification of the DA diameter in mCherry+ and mCherry–DA segments. In all graphs, error bars show SD; *p<0.05, **p<0.01, ****p<0.0001, Student’s t-test. 3 replicate experiments were performed in A-H, and 2 replicate experiments were performed in I-K; data points from separate replicate experiments are shown in different colors.

