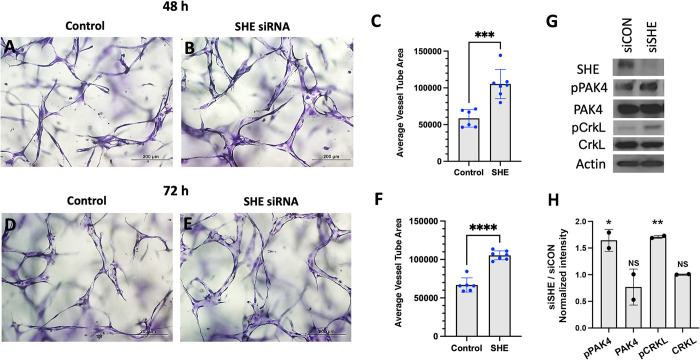
Fig 8. Inhibition of SHE in HUVECs results in enlarged tubulogenesis.
(A-F) HUVEC cells were transfected with either control or SHE siRNA and analyzed in 3D collagen matrix assay at 48 (A-C) or 72 h (D-F) after transfection. The values (± standard deviation) are derived from 6–7 representative fields from 3 replicate wells where total EC tube area was measured. *** p<0.001; ****p<0.0001, Student’s t-test. (G) Western blots for expression of SHE and phosphorylation of PAK4, and CRKL in HUVEC cells transfected with a control or SHE siRNA. Note greatly reduced SHE expression and increased pPAK4 and pCRKL in cells transfected with siSHE RNA. Analysis was done at 48hr after transfection except for pCRKL and CRKL, which are 72 hr. Two replicate experiments were performed; full results are shown in S11 Fig. (H) Relative intensity ratio in siSHE / siControl samples. Note increased intensity in pPAK4 and pCRKL samples compared to siControl (which equals to 1); *p<0.05, **p<0.01, Student’s t-test.

