
Figure 2:
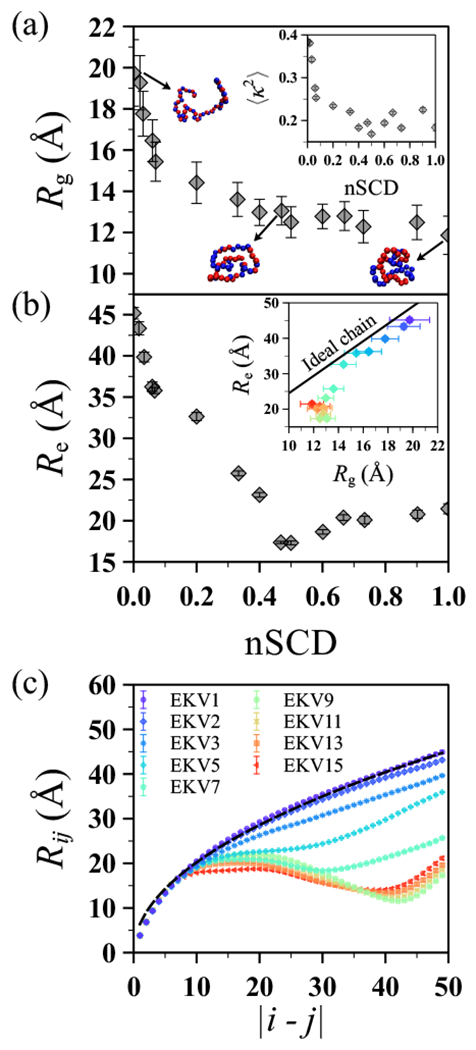
(a) Radius of gyration as a function of nSCD for the EKVs in Figure 1 along with representative conformations for select EKVs. The inset shows the relative anisotropy as a function of nSCD for the same EKVs. (b) End-to-end distance as a function of nSCD for the same EKVs. The inset shows the correlation between and from the simulations compared to the theoretical expectation for an ideal chain . (c) Interresidue distance as a function of residue separation in the chain for select EKVs. The dashed line corresponds to the ideal chain scaling , where was fitted for EKV1 using the theoretically expected end-to-end distance of an ideal chain with . The symbol color, ranging from purple to red, indicates increasing nSCD. The same color scale is used in the inset of (b).