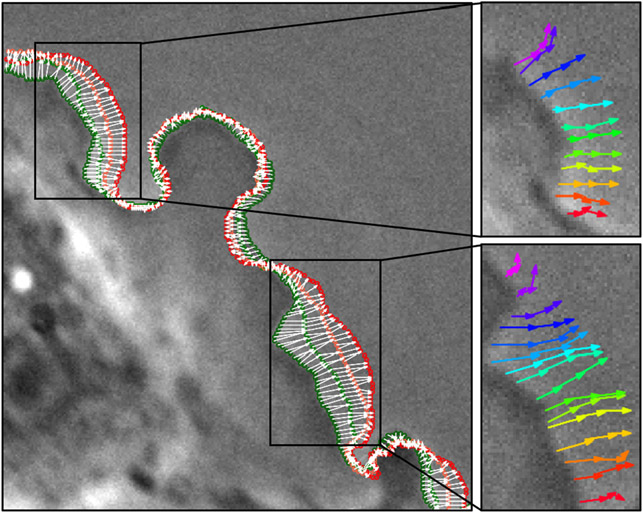
Figure 1. Visualization of contour tracking results.
Dense point correspondences between adjacent contours are shown with white arrows overlaid on the first frame. The first frame’s contour points are in dark green, and the last frame’s contour points are in red. Only half of the contour points and correspondences are shown for visualization purposes. The trajectories of a few tracked points are shown on the right.

