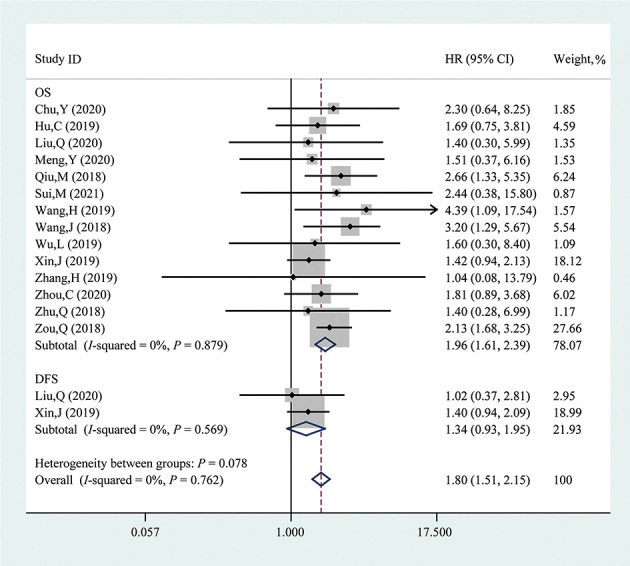
Figure 2.

Forest plot evaluating the association between circPRKCI expression and OS or DFS. The dotted line in the figure means the hazard ratio of the overall pooled result while the rhombuses in the figure mean the hazard ratios and the 95% CIs of the pooled results (overall and subtotal). circPRKCI: Circular RNA Protein Kinase C Iota; CI: Confidence interval; DFS: Disease-free survival; HR: Hazard ratio; ID: Identity document; OS: Overall survival.
