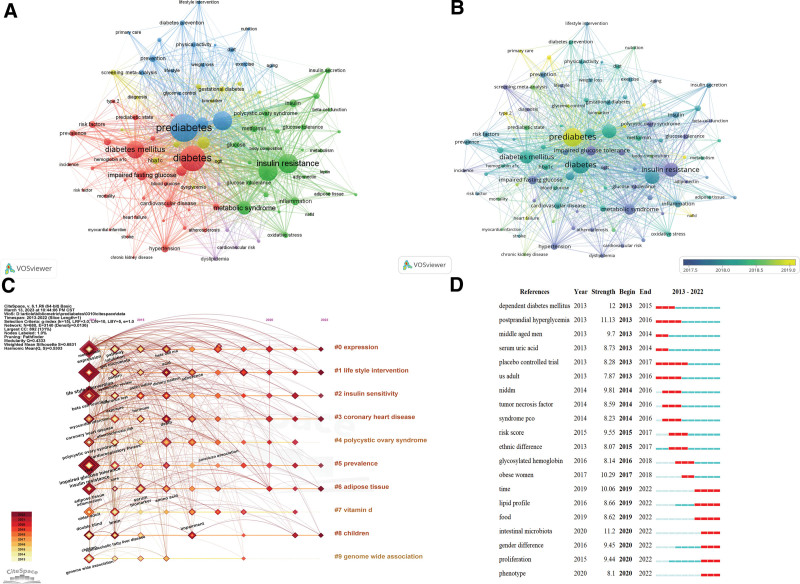
Figure 9.
The key words of pre-diabetes mapping. (A) The network of keywords, the 94 terms that appared more than 50 times. (B) Keyword visualization according to the APY. The different colors indicate the relevant year of publication. Yellow keywords came later than purple keywords. (C) The timeline distribution of 10 clusters. (D) Top 20 key words with the strongest citation bursts.

