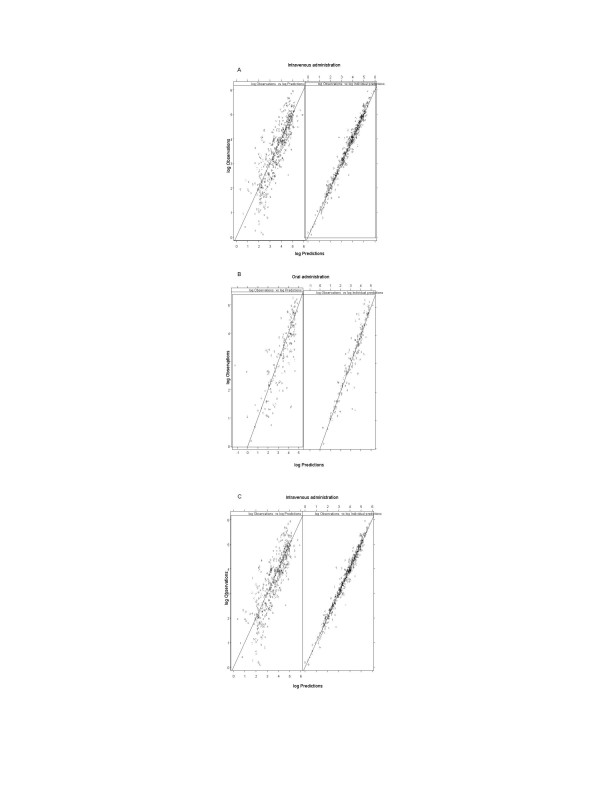
Figure 3.
Model predicted versus observed cladribine concentrations after intravenous infusion (A), oral (B) and subcutaneous (C) administration. In the left panel predictions are based on the parameters of the typical individual whereas in the right panel predictions are based on individual parameter estimates. ID numbers has been used as plotting symbols and all observations for an individual are connected by a broken line. Concentrations are given on a logarithmic scale to facilitate model inspection.

