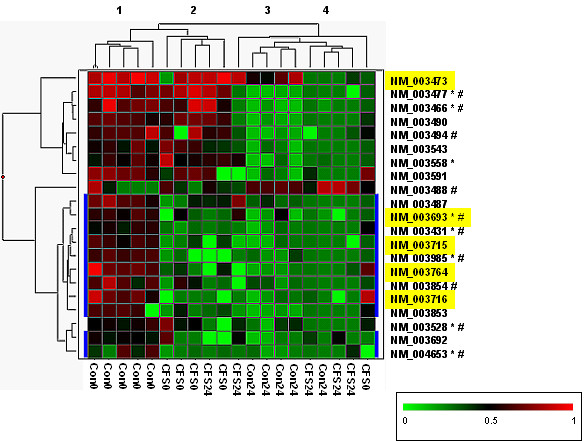
Figure 1.

Hierarchical clustering of exercise responsive genes in control subjects. The 21 differentially expressed genes identified by a class comparison test of control subjects (before and after exercise challenge (Table 2)) were clustered using a two-way hierarchical algorithm. In the matrix each row represents the hybridization results for a single gene, and each column represents a subject. Transcript levels are depicted as above (red) or below (green) the mean. The dendograms illustrates average-linkage hierarchical clustering of subjects (top) and genes (left). Refseq IDs for each gene is given on the right of the matrix. Those with similar exercise responses in both CFS and control subjects are at the top of the matrix, and the remainder of genes (highlighted in blue) show a diminished exercise response in CFS cases. Refseq IDs highlighted in yellow classify to the GO categories of protein or vesicle-mediated transport (Biological Process). Refseq IDs followed by:  are classified to the GO category of binding (Molecular Function); and/or # are classified in the GO category of metabolism (Biological Process). The subjects group into 4 clusters which approximate to: 1) Control subjects before exercise (Con0); 2) CFS cases before exercise (CFS0); 3) Control subjects after exercise (Con24); and 4) CFS cases after exercise (CFS24).
