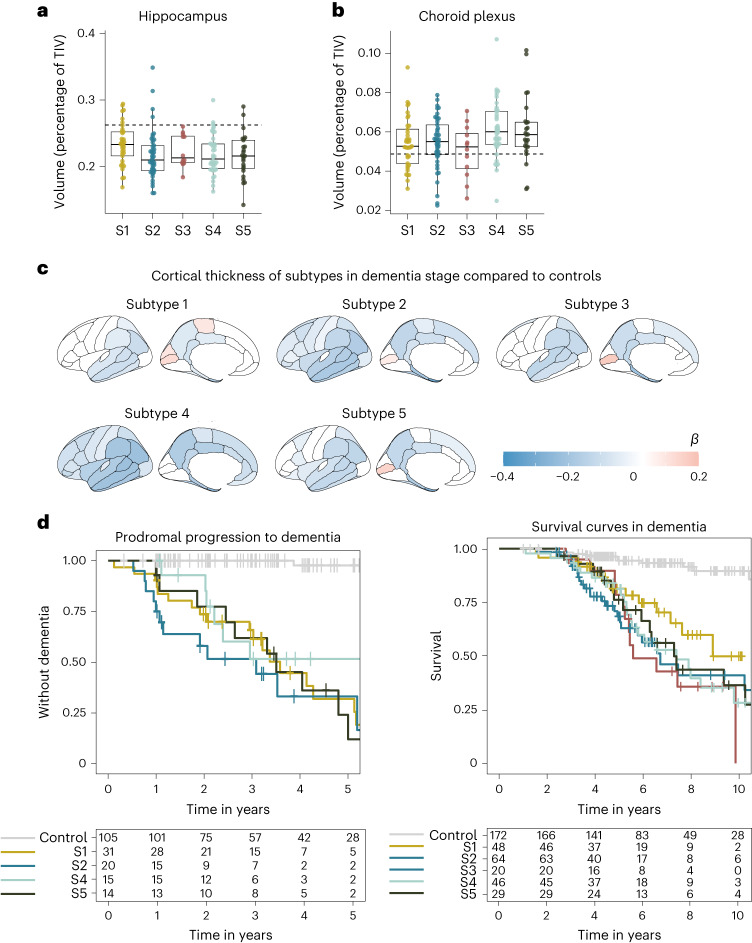
Fig. 2. AD subtype comparisons on MRI and clinical outcomes.
a, Median hippocampal volume as the percentage of total intracranial volume (TIV) compared to subtypes in the dementia stage. b, Choroid plexus volume as the percentage of TIV compared to subtypes in the dementia stage. c, Cortical atrophy associated with AD subtypes in the dementia stage compared to controls (n = 160). β indicates mean cortical thickness in mm, averaged over the right and left hemispheres and adjusted for age and sex. d, Clinical progression from MCI to dementia according to subtype (left; excluding subtype 3 due to n = 2) and time from dementia to death according to subtypes (right). All atrophy measures are based on individuals with dementia only. a,b, The boxplots depict the median in the center; the boundaries indicate the first and third quartiles, while the whiskers extend up and down to 1.5 times the interquartile range (limited to actual observed data points), and the points indicate individual person values (subtype 1, n = 37; subtype 2, n = 45; subtype 3, n = 12; subtype 4, n = 40; subtype 5, n = 25). See Supplementary Tables 6a,b and 8 for the detailed statistical metrics.

