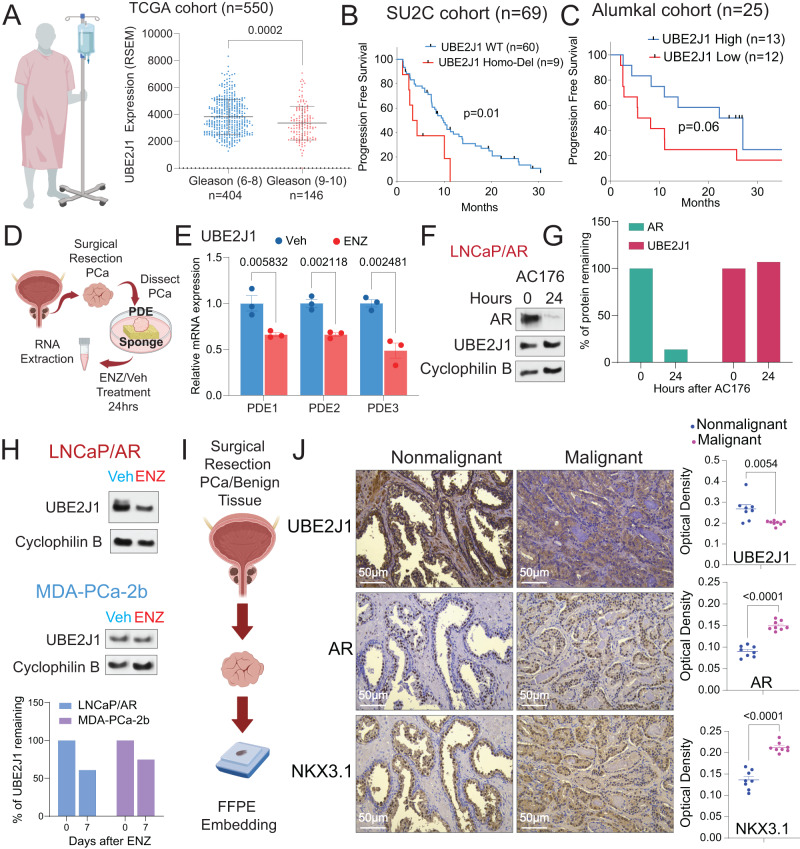
Fig. 6. UBE2J1-loss correlates with poor clinical outcomes.
A Expression of UBE2J1 in the high-grade tumors (Gleason score ≥ 9, n = 146 tumors) compared to the low-grade tumors (Gleason score ≤ 8, n = 404) in TCGA cohort. p values were calculated using two tailed t-test. Schematic figure was created with BioRender.com. B, C Kaplan–Meier curve represents the treatment duration on antiandrogen of patients with high or low expression of UBE2J1 in the B Stand up to Cancer (SU2C) cohort and C the Alumkal 2020 cohort. Abi abiraterone, ENZ enzalutamide, Apa apalutamide. p values were calculated with log-rank test. The number (n) of patients were annotated in each cohort. D Schematic figure represents the establishment of patient-derived explant (PDEs) models treated with Veh or 10 µM enzalutamide for 24 h. Schematic figure was created with BioRender.com. E Relative gene expression of UBE2J1 in independent patient-derived explants (n = 3) treated with Veh (DMSO) or ENZ for 24 h. p values were calculated using multiple t-tests with Benjamini correction. mean ± s.e.m. is presented. F Western blot represents AR, UBE2J1 and Cyclophilin proteins in LNCaP/AR parental cells treated with AR degrader (16 nM AC176) for the annotated hours. G Bar plot represents quantification of AR and UBE2J1 expression of western blot in panel (E). H Western blot represents UBE2J1and Cyclophilin B proteins in LNCaP/AR and MDA-PCa-2b parental cells treated with Veh (DMSO) or 10 µM ENZ for LNCaP/AR and 1 µM ENZ for MDA-PCa-2b for 7 days. Bar plot represents quantification of UBE2J1 expression of western blot. I Representative schematic of the establishment of de-identified formalin-fixed paraffin-embedded (FFPE) PCa samples. Schematic figure was created with BioRender.com. J Immunohistochemistry (IHC) staining of UBE2J1, AR and NKX3.1 proteins on PCa tumors and matched benign tissues. Scale bar represents 50 µm. Statistical analysis of representative pictures (n = 8) is presented, and p values were calculated using two-tailed t-test. For all panels, mean ± s.e.m. is presented.

