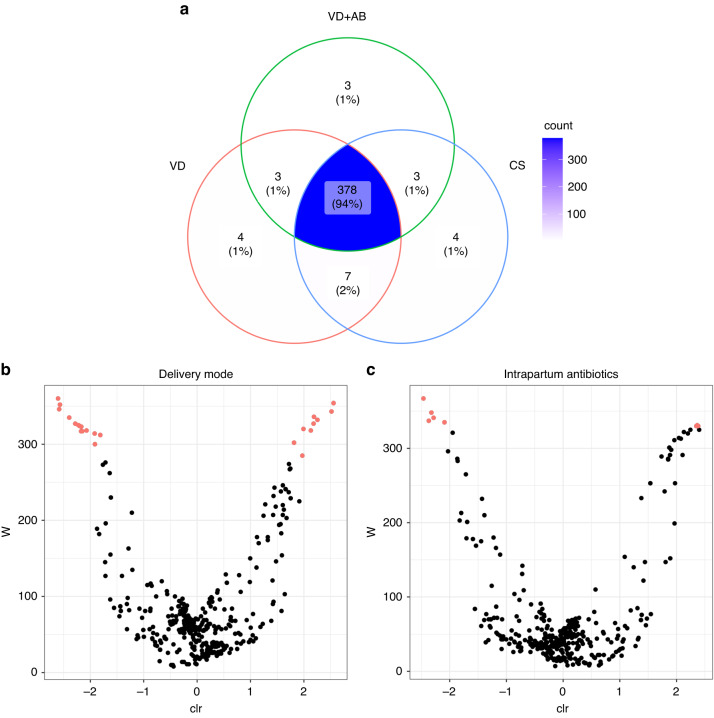
Fig. 4. PICRUSt2 results of meconium samples based on the mode of delivery and exposure to intrapartum antibiotics.
a A Venn diagram of predicted metabolic pathways shared between the sample groups. b Volcano plot of the abundances of the predicted metabolic pathways that differed according to the delivery mode. c Volcano plot of the predicted metabolic pathway abundances that differed according to intrapartum antibiotic exposure. Pathways that differ in abundance are colored red. The pathway labels were removed from the plots due to overlaps.

