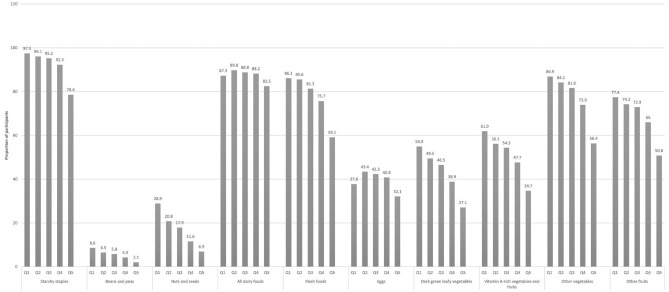
Fig. 1.
Proportion of participants who consumed each of the 10 Food Group Indicators (FGIs)† across quintiles of energy contribution of ultra-processed foods¥. Australian population aged 2+ years (NNPAS 2011–2012) (n = 11,862). Notes: NNPAS National Nutrition and Physical Activity Survey. †p value of linear trend < 0.001 across quintiles using regression models adjusted for age, sex, educational attainment, socio-economic status, income and geographical location was observed for all food groups, except dairy (p = 0.09) and eggs (p = 0.01). ¥Percentage of total energy intake from ultra-processed foods. Mean (43.69 ± 0.21); quintiles mean and range: Q1 = 20.26 (0 to 28.72); Q2 = 34.08 (28.73 to 38.79); Q3 = 43.22 (38.80 to 47.76); Q4 = 52.59 (47.76 to 58.12); Q5 = 68.33 (58.12 to 100)

