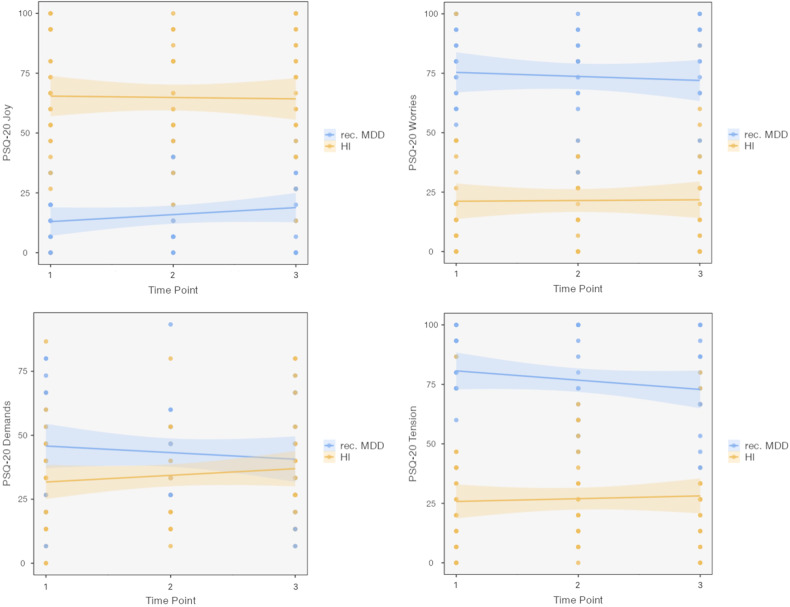
Fig. 3. PSQ-20 scores of the subscales worries, tension, joy, and demands from 18 patients with recurrent major depressive disorder (rec. MDD) and 28 healthy individuals (HI). Box-plot (y-axis) demonstrates the distribution of scores.
Analysis showed a significant main effect of group for the subscales worries (F = 19.19, p < 0.001), tension (F = 34.44, p < 0.001), and joy (F = 12.05, p = 0.001), but no main effect of group for the PSQ-20 subscale demands (F = 2.13, p = 0.15). We found no main effect of time (all p > 0.1) and no interaction of time and group (all p > 0.1).

