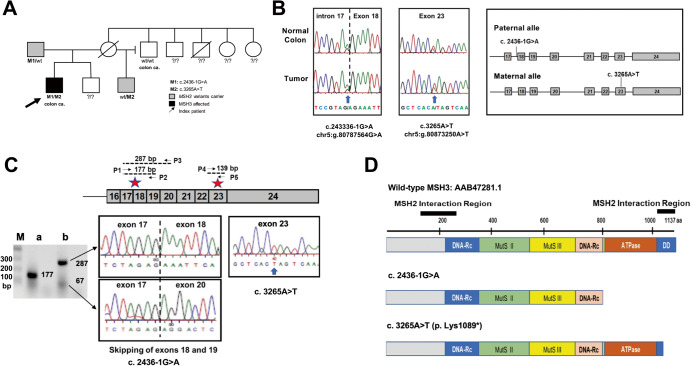
Fig. 1. Germline Mutations in MSH3.
A Pedigree of the index patient. Genotype is indicated as combination of MSH3 M1 and M2 alleles, with M1 as c. 2436-1 G > A and M2 as c. 3265 A > T, and ?/? as unknown. B Variants within the MSH3 gene and location. The variants found through next generation sequencing were validated by Sanger sequencing. The left panel represents chromatograms showing the G to A variant at the splice acceptor site of exon 18 of MSH3 in normal colon and tumor genomic DNA. The vertical dashed line shows the boundary between intron 17 and exon 18. The arrow indicates G > A variant. The middle panel represents chromatograms showing A > T variants in exon 23 (arrow). The right panel shows variant positions within the MSH3 gene locus. The genomic region spanning from exon 17 to exon 24 of the MSH3 loci (paternal and maternal) is presented. C Variant MSH3 Transcripts. Top diagram represents partial mature transcript of MSH3 (from exons 16 to 24). The positions of PCR primers that amplify between exons 17 and 19 (P1/P2), exons 17 and 20 (P1/P3) and within exon 23 (P4/P5) and expected size of each PCR product are presented. The red stars indicate the position affected by the variants. The agarose gel on the left shows the PCR product amplified by P1/P2 (lane a) and PCR products amplified by P1/P3 (lane b) using cDNA from the index patient. P1/P2 generated a normal 177 bp PCR product indicating that there is no transcript skipping exon 18. P1/P3 generated a normal 287 bp product and abnormal 67 bp products, suggesting that one of two transcripts lost exons 18 and 19. M = molecular marker, in bp. The upper middle chromatogram shows a partial sequence of the 287 bp PCR products that contain normally spliced exons 17 and 18. The bottom middle chromatogram shows a partial sequence of the 67 bp PCR products generated by P1/P3. Skipped exons 18 and 19 were detected due to a paternal c.24336-1 G > A variant. The right chromatogram shows a partial sequence of exon 23 generated by P3/P4 (139 bp). Only variant T due to maternal c.3265 A > T was detected (arrow), indicating that transcript from paternal allele is missing exon 23. D Predicted Variant MSH3 Proteins. The top diagram represents wild-type MSH3 proteins (1137aa). The gray region represents the N-terminus of MSH3 containing the NLS and EXO1 interaction region; blue and pink regions contain DNA recognition sites (DNA-Rc); green region has a connector domain; yellow region is the central structure of MSH3; orange region has ATPase activity and a C-terminus; and the blue is the dimerization domain (DD) with MSH2. The black bars represent MSH2 interaction regions. Middle diagram: MSH3 derived from c. 2436-1 G > A is predicted to lose the C-terminus end of 315 aa including ATPase and the DD regions. Lower diagram: MSH3 derived from c 3265 A > T may lose the C-terminus end of 49 aa that is a part of the DD region.

