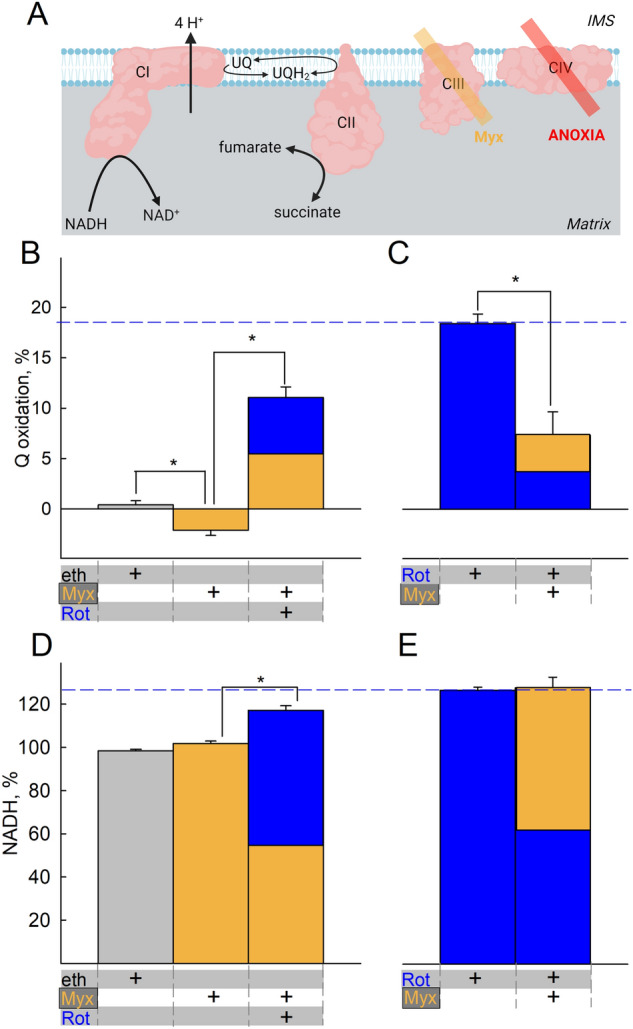
Figure 2.

CIII does not mask CI operation during anoxia. (A) Scheme illustrating the action of inhibitor(s) used downstream of CI in the experiments shown in the figure (created with BioRender.com). Quantification of inhibitor-induced changes in UQ (B,C) or NADH (D,E) signal. Vehicle or inhibitors present as indicated by the plus ( +) signs at the bottom of the panels. Substrates were glutamate and malate (5 mM each) present in the buffer prior to addition of mitochondria. Eth ethanol (grey), Myx myxothiazol, 0.1 μM (orange), Rot rotenone, 1 μM (blue). The additions of the compounds mentioned in the bottom of each panel were made from top to bottom. Data pooled from 3 to 37 independent experiments. *p < 0.05.
