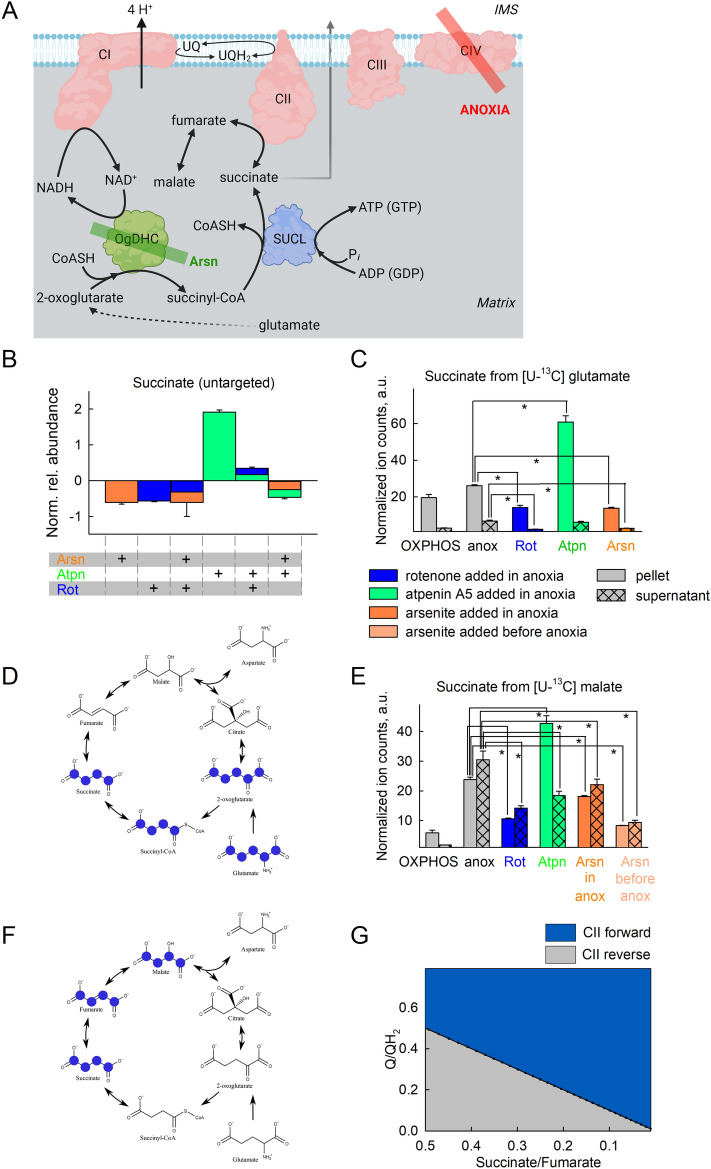
Figure 5.
Oxidation of NADH by CI supports OgDHC, in turn maintaining the oxidative decarboxylation of 2-oxoglutarate during acute anoxia. (A) Scheme illustrating the action of inhibitor(s) used downstream of CI in the experiments shown in the figure (created with BioRender.com). (B) Untargeted metabolite analysis of succinate present in the pellets of mitochondria treated with the conditions indicated in the panel; substrates were glutamate (5 mM) and malate (5 mM). The y-axis illustrates normalized, log transformed, and scaled peak area. Arsn (orange) arsenite, 2 mM; Atpn (green) atpenin A5, 1 μM; Rot (blue) rotenone, 1 μM. (C,E) Targeted 13C metabolic tracer analysis of succinate present in the effluxes (supernatants) or pellets of mitochondria treated with the conditions indicated in the panel, when using [U-13C]glutamate (5 mM) in the presence of malate (5 mM, (C)) or [U-13C]malate (2.5 mM) in the presence of glutamate (5 mM, (E)). (D,F) Schemes illustrating the paths of 13C labels in glutamate or malate to succinate during anoxia, respectively. Marvin was used for drawing chemical structures, Marvin version 21.18, ChemAxon, (https://www.chemaxon.com). (G) 2D plot of CII directionality depicted from succinate/fumarate ratio as a function of Q/QH2 ratio.

