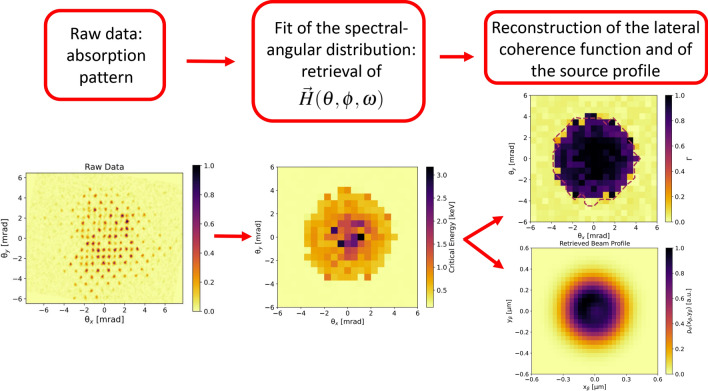
Figure 2.
Flow chart of the procedure adopted in this paper, for the reconstruction of the lateral coherence function and of the X-ray source profile. From left to right: the raw data (left figure) shows an absorption pattern. For each observation angle (each identified by a micropattern that repeats across the absorption mask), a radiation field is calculated having the spectral properties to locally fit the measured absorption pattern. The best fitting radiation field enables the measurement of the spectral-angular distribution of the X-ray source (central figure). From the spectral-angular distribution of the X-ray source, the lateral coherence function is retrieved (top-right figure), by means of its definition in terms of the radiation field (Eq. (3)). Moreover, being the spectral-angular distribution of the radiation field related to the transverse profile of the X-ray source, the latter can also be reconstructed (bottom-right figure).

