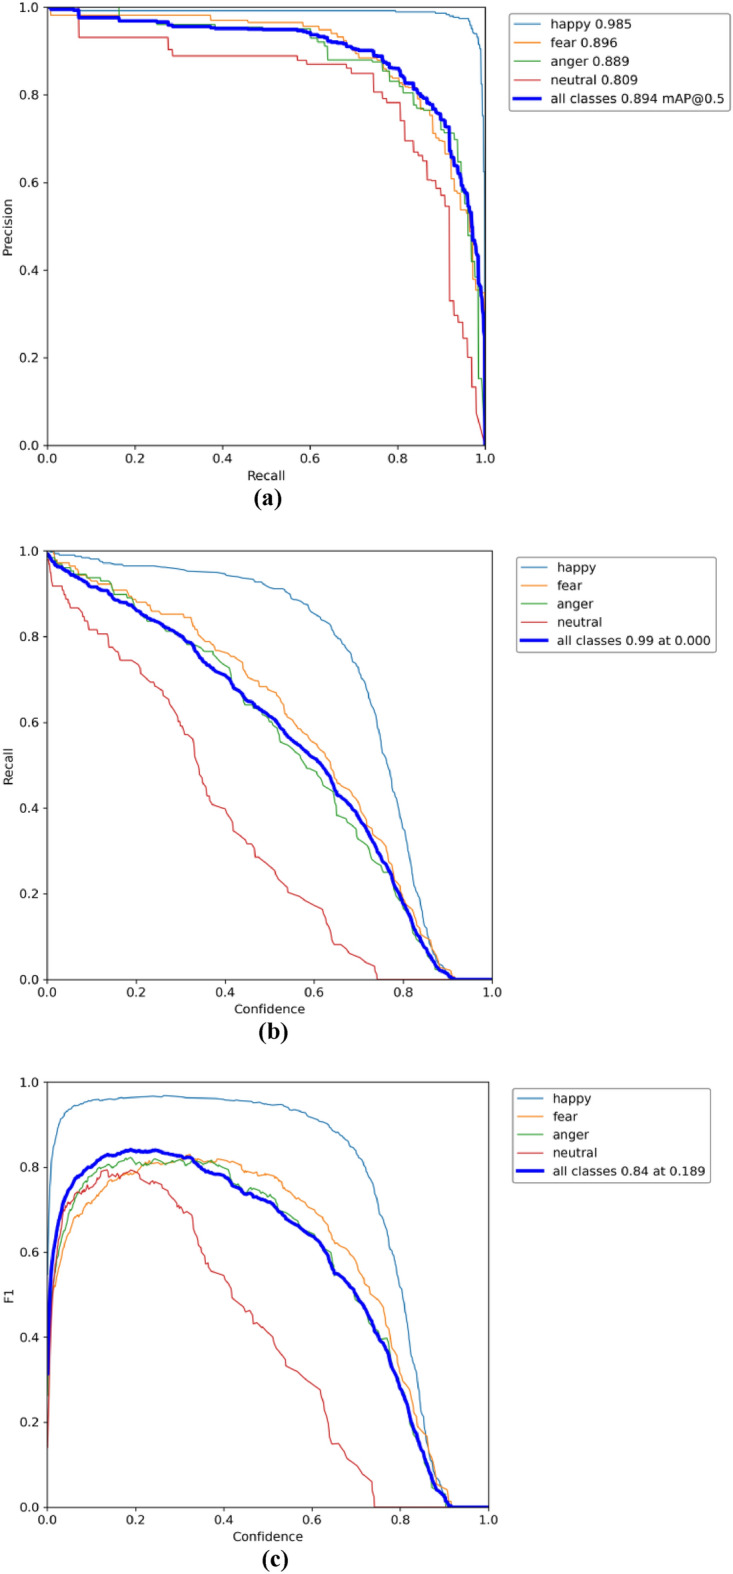
Figure 8.

CReToNeXt-YOLOv5 model test results: (a) represents the precision–recall curve, showcasing an optimal trend of model performance over different thresholds. Solid blue line: represents the mean average precision (mAP) of the model, denoting an overall detection accuracy of 0.894 across all categories; (b) represents the recall rate, achieving a high mark of 0.99, indicating the model's proficiency in identifying relevant instances; (c) denotes the F1-score across all classes, peaking at 0.84 at a threshold of 0.189, highlighting the model's balanced performance between precision and recall.
