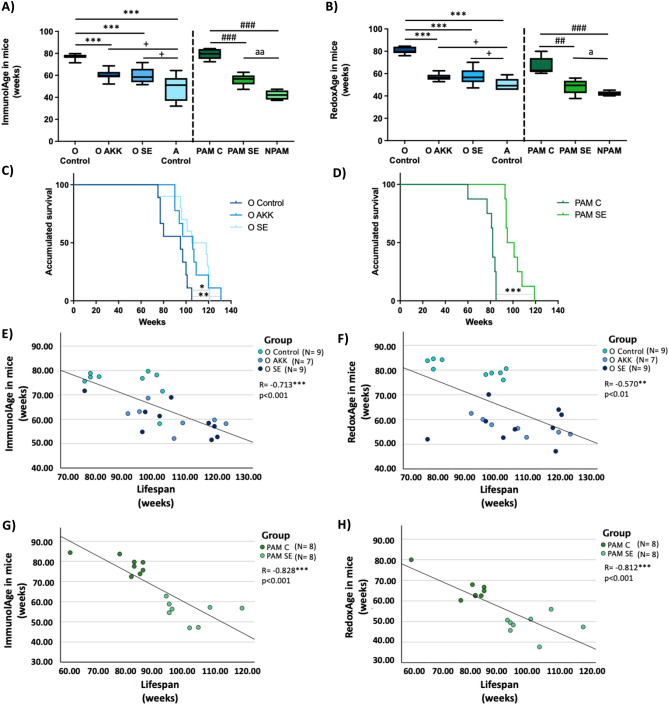
Figure 4.
(A) Immunity Clock applied to mice after positive lifestyle interventions. (B) Redox Clock applied to mice after positive lifestyle interventions. (C) Kaplan Meier cumulative survival of O Control, O AKK and O SE. (D) Kaplan Meier cumulative survival of PAM C and PAM SE. (E) ImmunolAge vs lifespan in old mice after nutritional and social interventions. Pearson’s correlation coefficient between ImmunolAge and Longevity is − 0.713 (p < 0.001). (F) RedoxAge vs lifespan in old mice after nutritional and social interventions. Pearson’s correlation coefficient between RedoxAge and lifespan is − 0.570 (p < 0.01). (G) ImmunolAge vs lifespan in adult PAM after social interventions. Pearson’s correlation coefficient between ImmunolAge and lifespan is − 0.828 (p < 0.001). (H) RedoxAge vs lifespan in PAM after social interventions. Pearson’s correlation coefficient between RedoxAge and Longevity is − 0.812 (p < 0.001). O Control, Old control; O AKK, old mice after Akkermansia ingestion; O SE, old mice after cohabitation with adult mice; A Control, Adult control; PAM C, prematurely aging mice control; PAM SE, prematurely aging mice after cohabitation with exceptional non-prematurely aging mice. *p < 0.05, **p < 0.01, ***p < 0.001 respect O Control. + p < 0.05 respect A Control. ##p < 0.01, ###p < 0.001 respect PAM C. a p < 0.05, aa p < 0.01 respect NPAM.

