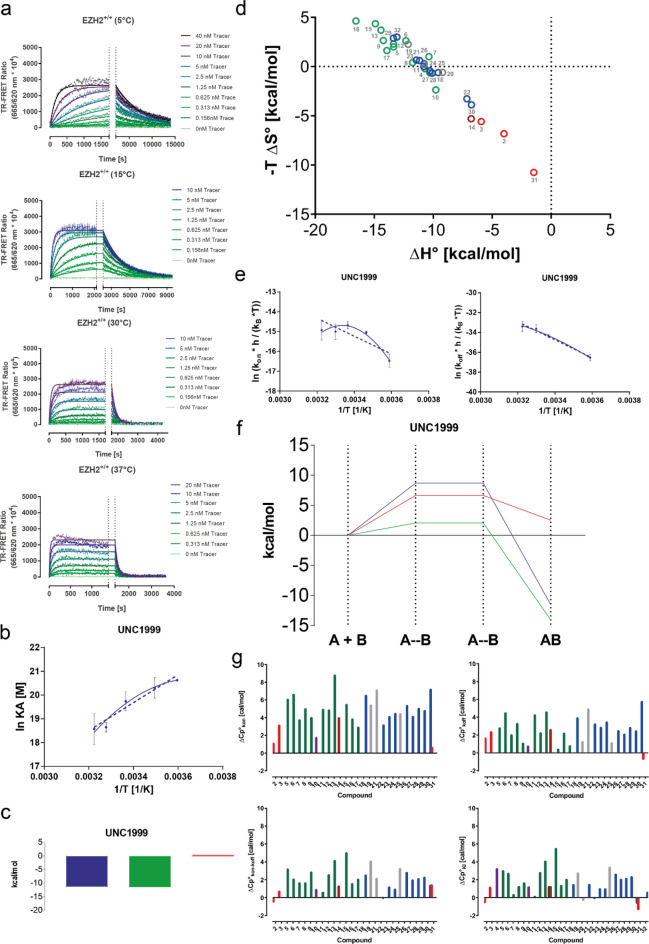
Figure 3.
Equilibrium and transition state thermodynamics of EZH2 binding by pyridone-based active site inhibitors. (a) Kinetic titrations of the probe on EZH2+/+ at different temperatures (indicated on the label of each graph). Increasing concentrations of the probe (provided on the right-hand side of each graph) were mixed with labeled enzyme and TR-FRET signals were recorded for 4 min. Equilibrium complexes were then disrupted by the addition of an excess amount of the unlabeled compound (marked with dotted vertical lines in the graph) and dissociation of the probe was followed until baseline fluorescence ratios were reached. Fitting of these kinetic traces to a global association and dissociation model led to the probe rate- and affinity constants shown in the Supplementary Table S1. (b) Equilibrium thermodynamics analysis derived from ePCA experiments for exemplary reference EZH2 inhibitor UNC1999. Dotted lines represent the fit of the data to the linear form of the van’t Hoff equation, whereas solid lines show the fit to the polynomial one. (c) Representative equilibrium thermodynamics profile of reference EZH2 inhibitor UNC1999. The blue, green, and red bars represent the Gibbs’ free energy (ΔG) enthalpy (ΔH), and entropy (-TΔS) components of the binding, respectively. (d) Equilibrium thermodynamic optimization plots of the 32 compounds investigated in this study. The labeling and colors of the data points describe compound names and structures as indicated in Fig. 2a and the Supplementary Spreadsheet. (e) Transition state thermodynamics analysis derived from kPCA experiments for exemplary reference EZH2 inhibitor UNC1999. Dotted lines represent the fit of the data to the linear form of the Eyring equation, whereas solid lines show the fit to the polynomial one. The left graph shows the analysis for the association phase, whereas the right graph displays the dissociation phase. (f) Transition state thermodynamics profile of exemplary reference EZH2 inhibitor UNC1999 investigated in this study. The blue, green and red bars represent the Gibbs’ free energy (ΔG) enthalpy (ΔH), and entropy (-TΔS) components of the binding, respectively. (g) Overview of heat capacity changes (ΔCp) for each compound investigated in this study. The upper panel shows kinetic ΔCp values derived from kPCA in the association (left hand side) and dissociation (right hand side) phases. The lower panel shows equilibrium ΔCp values derived from kPCA (left-hand side) and ePCA (right-hand side). The labeling and colors of the data points describe compound names and structures as indicated in Fig. 2a and the Supplementary Spreadsheet.

