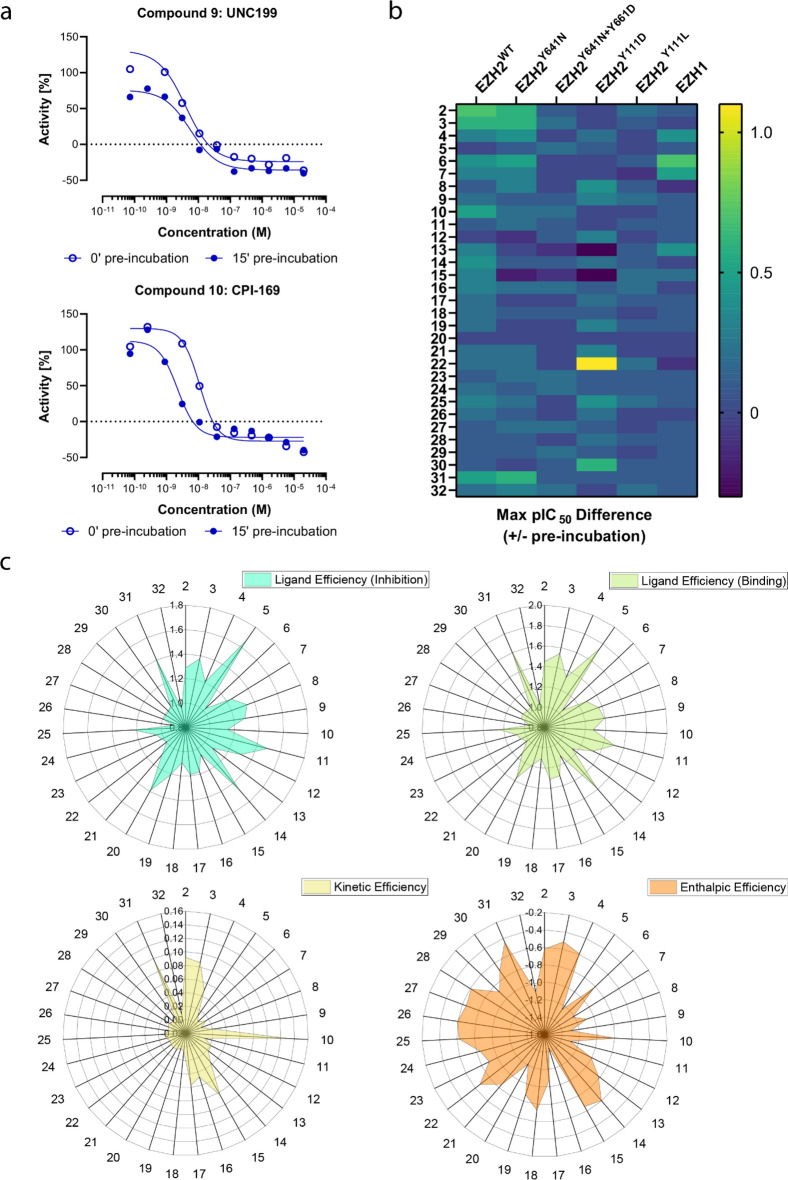
Figure 4.
Impact of compound binding kinetics on biochemical EZH2 inhibition and comparison of kinetic-, thermodynamic- and conventional ligand efficiency parameters. (a) Representative enzyme inhibition curves for EZH2+/+ by two reference inhibitors +/− compound and protein pre-incubation. (b) Effects of increasing compound and protein pre-incubation times on the inhibition of different PRC complexes by the compounds analyzed in this study. The color code represents maximum differences in pIC50 values +/− compound and protein pre-incubation, using the no pre-incubation pIC50 value as reference. The PRC complexes evaluated are indicated on the top. (c) Radar plots representing the ligand efficiencies of the compounds analyzed in this study calculated based on their biochemical inhibition (top left), TR-FRET equilibrium binding affinities at 25 °C (top right), residence times derived from TR-FRET kinetic binding (kPCA) assays at 25 °C (bottom left) and enthalpies from TR-FRET equilibrium binding affinities at multiple temperatures (bottom right).

