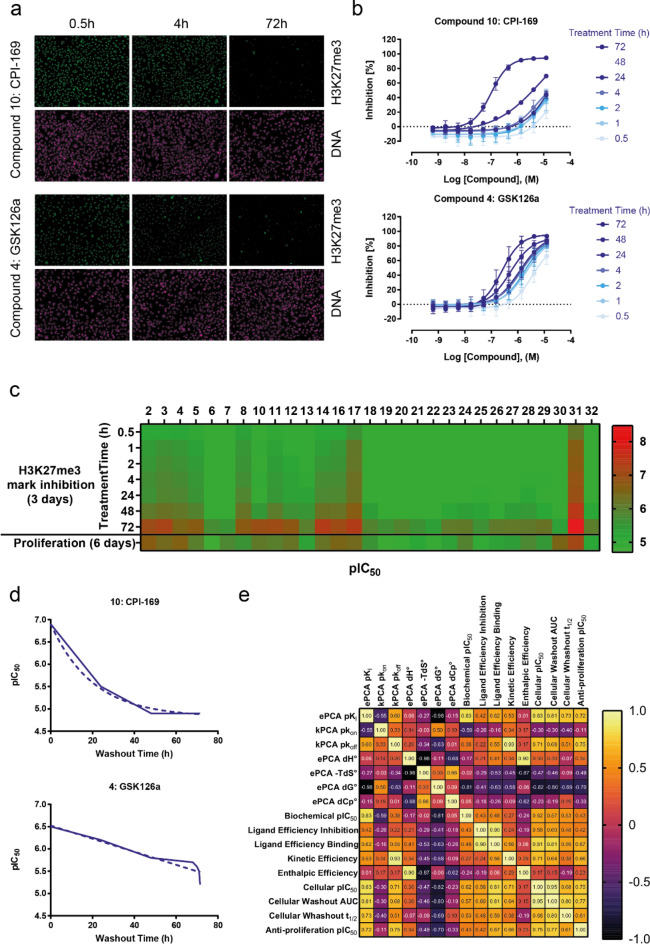
Figure 5.
Time-dependent inhibition of Histone H3 Lys27 trimethylation in cells treated with pyridone-based active site EZH2 inhibitors. (a) Representative high-throughput fluorescence microscopy images of MDA-MB-231 cells treated with GSK126 and CPI-169, two representative EZH2 inhibitors from the indole class. Compounds were washed out upon different incubation times (pictures show three out of seven time points) and cells were fixed and stained with Hoechst 33342 for total DNA and a specific antibody recognizing the H3K27me3 mark. (b) Representative curves showing the inhibition H3K27me3 mark by increasing doses- and incubation times of the two compounds shown in (A). Normalized inhibition values were plotted versus the compound dose and the resulting curves were fitted to a 4-parameter logistic equation to derive the IC50 per incubation time values listed in the Supplementary Spreadsheet. (c) Overview of the time dependency of H3K27me3 inhibition by all EZH2 inhibitors investigated in this study. The heat map shows pIC50 values obtained at the different incubation times tested in the experiment (first seven rows). These values are compared with the KARPAS anti-proliferative effects of these compounds in a 6-day assay (bottom row). (d) Representative progression curves for GSK126 and CPI-169 reflecting the cellular potency of these compounds (y-axis) as a factor of the time cells were treated with them (x-axis). The solid lines show the actual data that served to calculate the area under the curve (AUC) for the potency decay with shorter incubation times. The dotted lines correspond to the fit to an exponential decay model, from which the washout half-life values (t1/2) were derived. (e) Spearman’s correlation matrix for the parameters investigated in this study. If data was acquired +/− H3K27me3 peptide, only the data with peptide is shown. Likewise, only biochemical inhibition with 15’ pre-incubation is represented. The color code in the heat map represents the Spearman’s coefficients, also given for the individual comparisons in the matrix.

