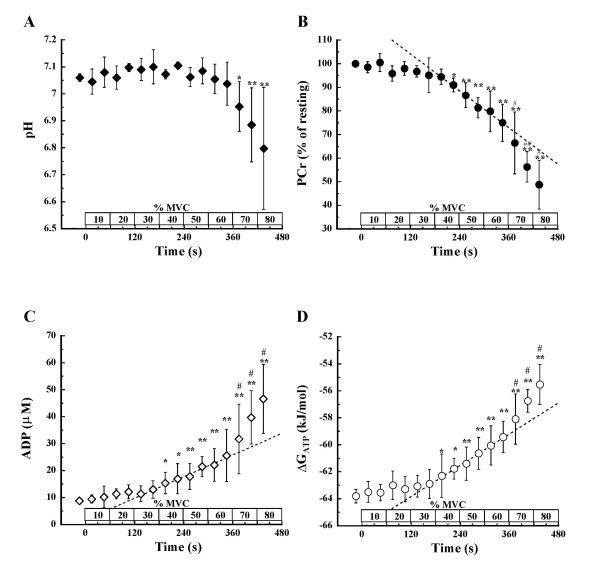
Figure 3.
Changes in muscle pH, PCr, ADP, and ΔGATP during incremental intermittent isometric plantar flexion exercise. Changes in (A) pH, (B) PCr, (C) ADP, and (D) ΔGATP during incremental intermittent isometric plantar flexion exercise. A dotted line in each panel B, C, and D represents a linear regression line which is drawn to obtain the highest correlation coefficient above 40% MVC, at which significant difference was observed when compared with the value obtained during the first 30 s at 10% MVC. Values shown are means ± SD of 5 subjects. * p < 0.05, **p < 0.01 vs. the value during the first 30 s at 10% MVC (first 30 s of exercise). #p < 0.05 vs. the value obtained during the 30 s of exercise immediately before.

