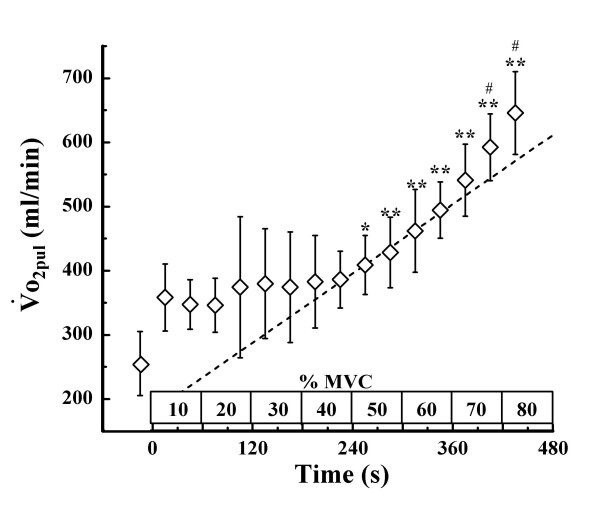
Figure 5.
Changes in  o2mus during incremental intermittent isometric plantar flexion exercise. A dotted line represents a linear regression line which is drawn to obtain the highest correlation coefficient above the first 30 s of 50% MVC at which significant difference was observed when compared with the value obtained during the first 30 s at 10% MVC Values shown are means ± SD of 5 subjects. * p < 0.05, **p < 0.01 vs. the value during the first 30 s at 10%MVC(first 30 s of exercise), # p < 0.05 vs. the value obtained during the 30 s of exercise immediately before.

