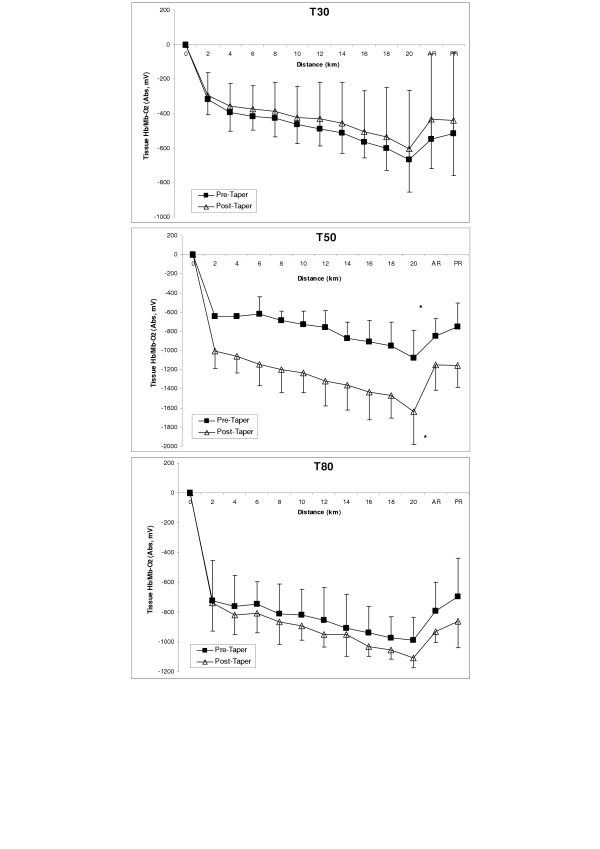
Figure 1.
Group mean (± SD) tissue oxygenation (Hb/Mb-O2; Absorbency, mV) during the simulated 20 km time trial performance ride Pre- and Post-taper in the three taper groups. Panel T30 (30% reduction in weekly training volume; n = 5); Panel T50 (50% reduction in weekly training volume; n = 5); Panel T80 (80% reduction in weekly training volume; n = 5). * denotes significance (p ≤ 0.05) between pre- vs. post-taper trials.

