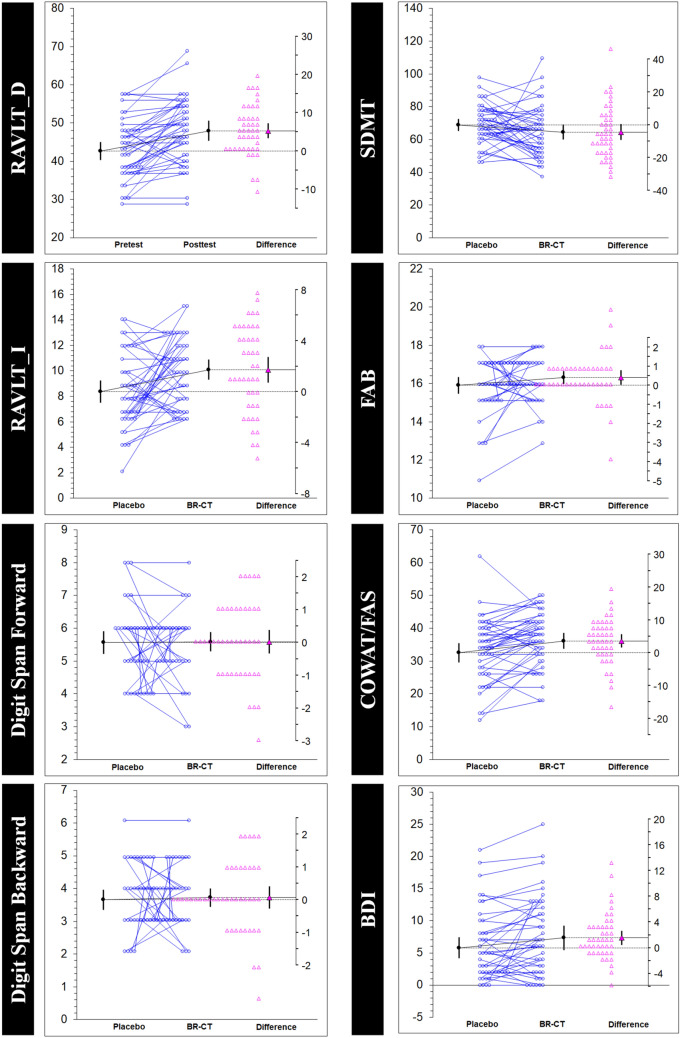
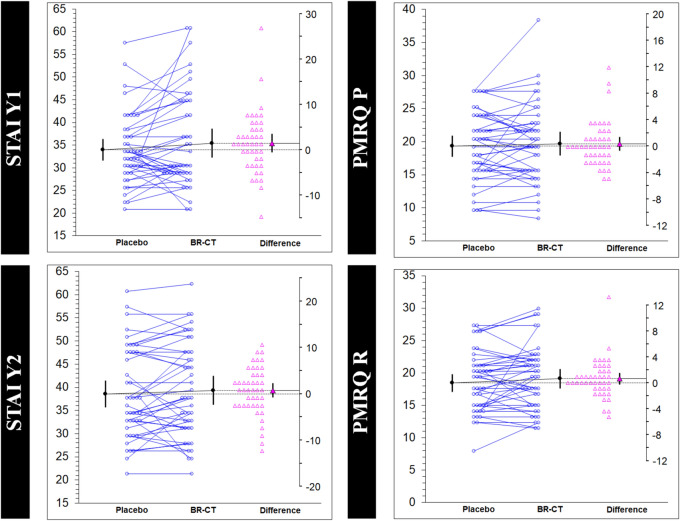
Fig. 4.
Estimation plots examining the within-participant comparisons on the study variables. Paired data from placebo (maltodextrin) and experimental (BR-CT) conditions are shown as small circles joined by blue lines. The differences between the placebo and treatment means are plotted on a floating difference axis whose zero is aligned with the placebo mean. The filled pink triangle marks the difference on that axis and the 95% CI on that difference is displayed. The differences are shown as open triangles on the difference axis


