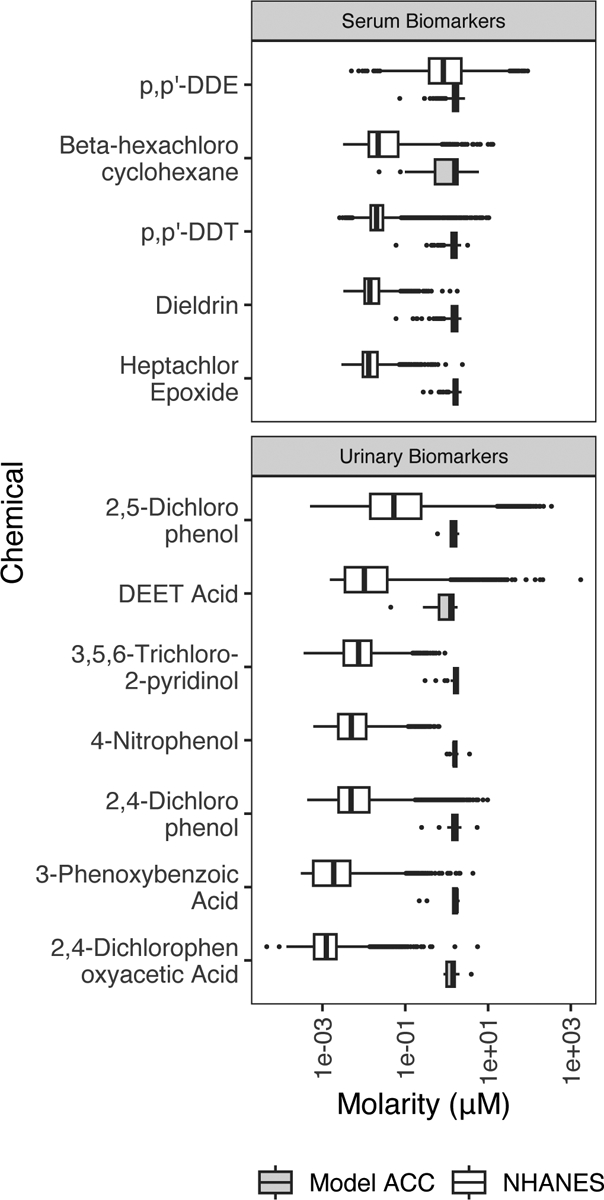
Figure 1.

Comparison of chemical biomarker concentrations, converted to molarity units, in NHANES participants and concentrations for bioactivity in vitro from ToxCast. There are a portion of NHANES subjects who have serum and/or urinary chemical measurements that meet or exceed bioactivity thresholds. Chemical molarity measurements taken from NHANES subjects are shown as the top boxplot for each chemical, shaded in white. Model ACCs (activity concentration at cutoff) from ToxCast are the minimum concentration for a specific assay where a chemical is considered active (bottom boxplot for each chemical, shown in gray).
