
Figure 2. Multivariable Estimates for Genetically Predicted Lipid Traits and Coronary Artery Disease (CAD), All-Cause Mortality, and Cause-Specific Mortality.
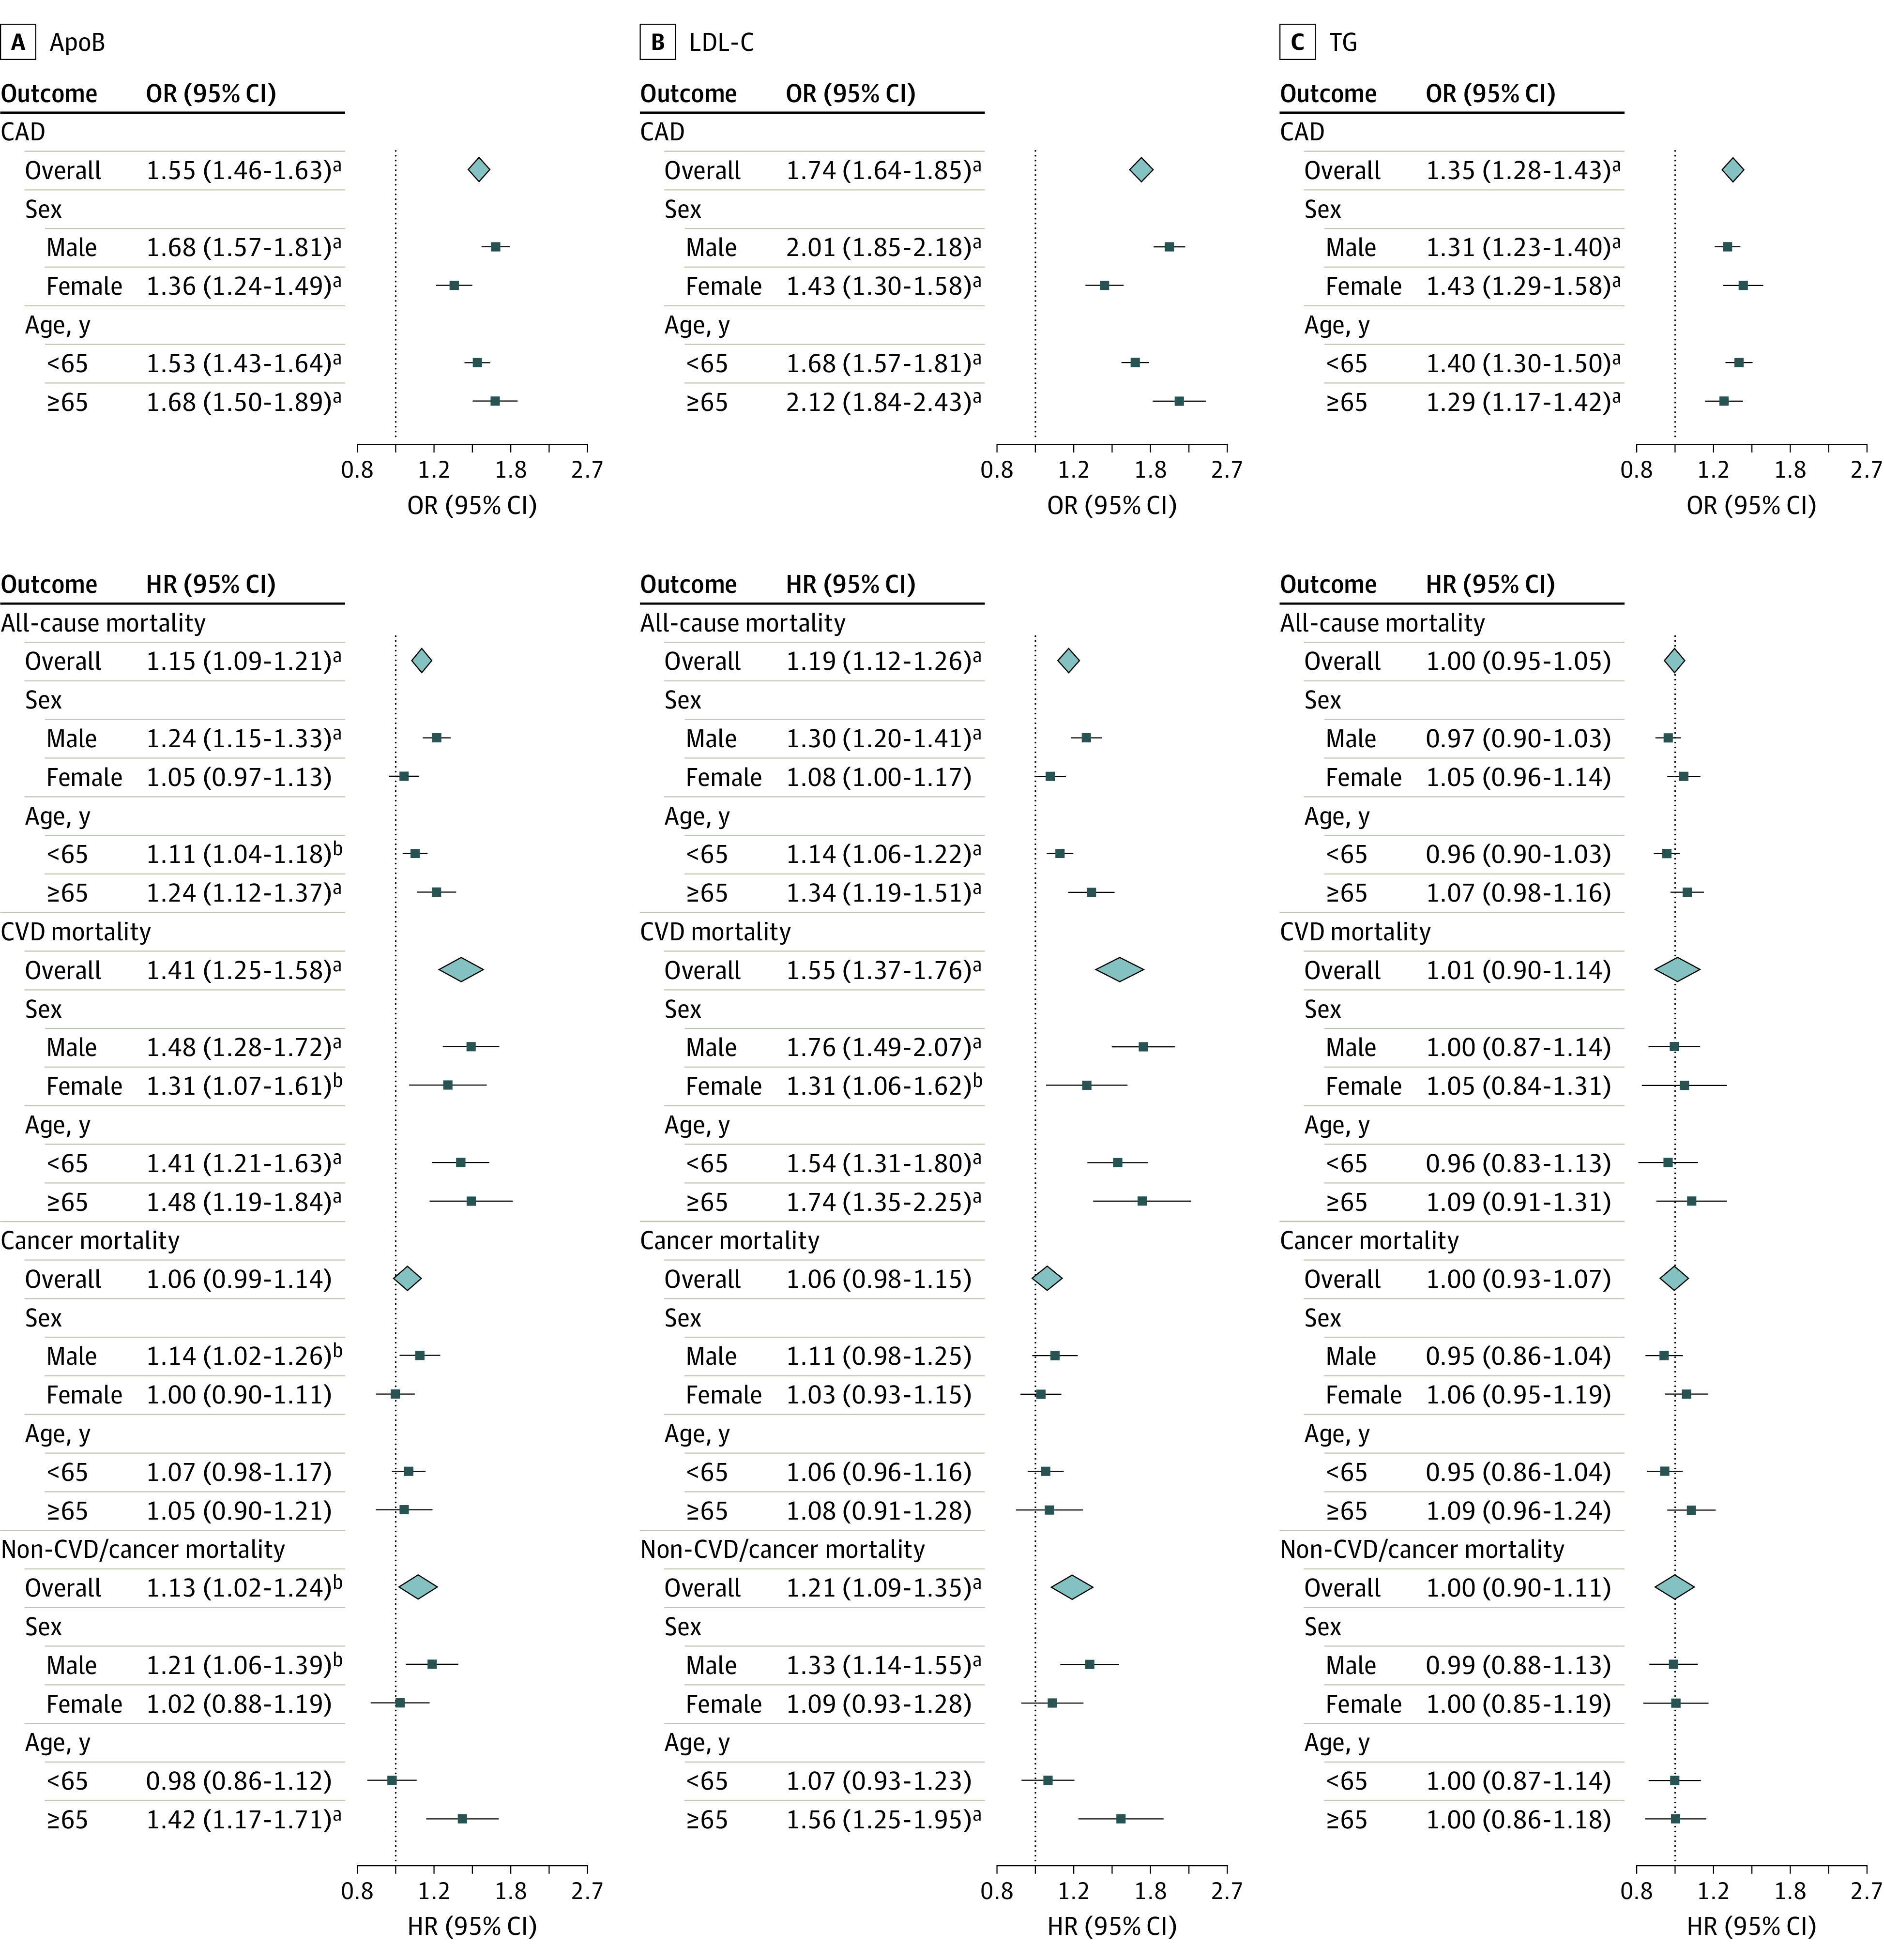
The figure shows multivariable estimates for apolipoprotein B (apoB), low-density lipoprotein cholesterol (LDL-C), and triglycerides (TG). Multivariable estimates for apoB and LDL-C were adjusted for TG, and multivariable estimates for TG were adjusted for apoB. Estimates are expressed as odds ratios (ORs) and hazard ratios (HRs) with 95% CIs per standard deviation increase in genetically predicted level of each lipid trait (approximately 23.8 mg/dL for apoB [to convert to grams per liter, multiply by .01], 33.2 mg/dL [to convert to millimoles per liter, multiply by 0.0259] for LDL-C, and 87.5 mg/dL [to convert to millimoles per liter, multiply by .0113] for TG). CVD indicates cardiovascular disease. Squares denote stratum estimates, and diamonds denote overall estimates. Error bars denote 95% CIs.
aP < 001.
bP < .05.