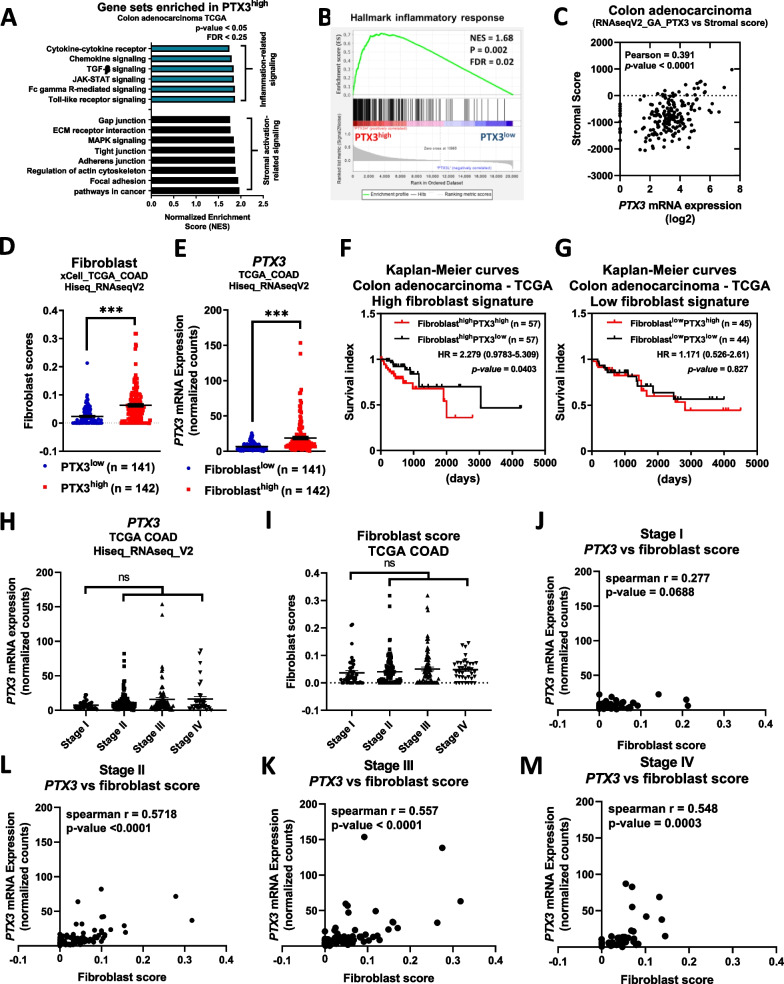
Fig. 1.
PTX3 expression is positively correlated with stromal and fibroblast signatures in colon cancer. A total of 287 colon adenocarcinoma samples represented in the TCGA dataset were divided into the PTX3high (n = 143) and PTX3low (n = 144) groups by the median cutoff value. A KEGG pathways related to cellular processes were selected for gene set enrichment analysis (GSEA), and the enriched signaling pathways (blue, inflammation-related signaling; and black, and stromal activation-related signaling) in PTX3high tumors are shown. The threshold criteria were p value of < 0.05 and FDR < 0.25. B GSEA of inflammatory response signature in the PTX3high (n = 143) and PTX3low (n = 144) groups. The threshold criteria were NES > 1.5, p value of < 0.05, and FDR < 0.25. C The stromal scores of 191 colon adenocarcinoma samples from the TCGA dataset were extracted via the ESTIMATE web tool and used for Pearson correlation analysis with PTX3 expression levels (log2). D, E Fibroblast scores in 283 colorectal tumor samples from the TCGA dataset were extracted from the xCell database. The samples were divided into the PTX3high (n = 142) and PTX3low (n = 141) expression groups or the fibroblasthigh (n = 142) and fibroblastlow (n = 141) score groups by the median cutoff value. F, G The survival index of 203 colorectal adenocarcinoma patients was obtained via the SurvExpress web-tool. The samples were divided into the fibroblasthigh (n = 114) and fibroblastlow (n = 89) group by the best cutoff value, and each of these groups was subdivided into a PTX3high group and a PTX3low group by the median cutoff value. H PTX3 expression and I fibroblast scores in different stages in the TCGA COAD dataset are shown. Spearman correlation analysis of PTX3 expression and the fibroblast score in stage I (J), stage II (K), stage III (L), and stage IV (M) tumors. p values were calculated by two-tailed unpaired Student's t test, one-way ANOVA, two-sided log-rank test, HR hazard ratio, or CI confidence interval. ns represents nonsignificant difference. ***represents a p value of < 0.001. Values on the plots are presented as the means ± SEMs

