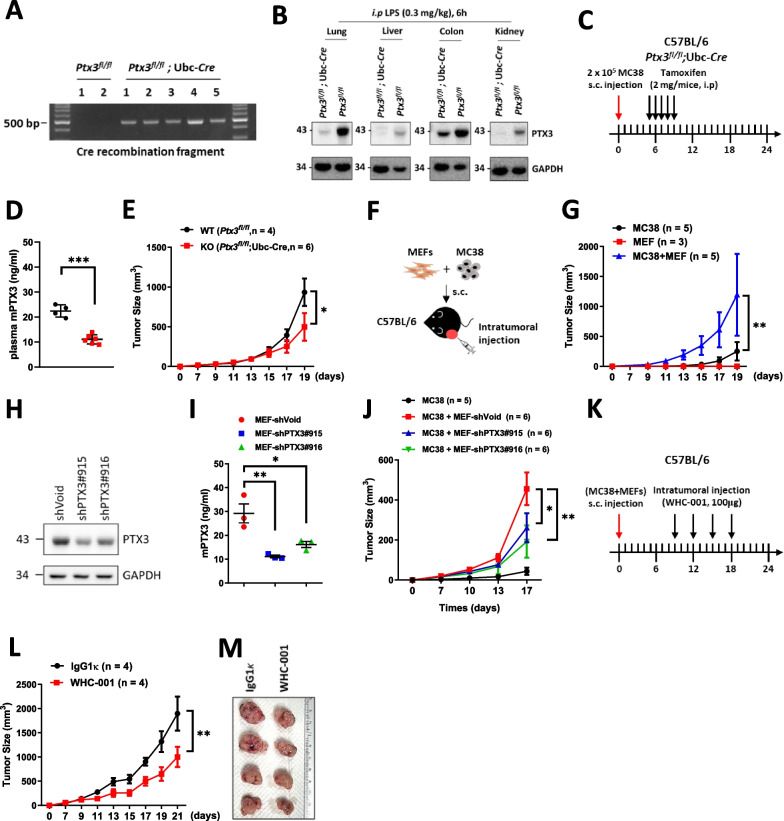
Fig. 3.
Inhibition of PTX3 reduces stroma-mediated tumor growth in vivo. Conditional knockout mice (Ptx3fl/fl or Ptx3fl/fl; Ubc-Cre) were given tamoxifen (2 mg/mice, i.p) to drive Cre expression and A colon tissues were harvested for genotyping by detecting the recombined fragment (Ptx3fl/fl, n = 2 and Ptx3fl/fl; Ubc-Cre, n = 5). B Conditional knockout mice were given tamoxifen (2 mg/mouse, i.p) daily for 5 days, and after another 5 days, were treated with LPS (0.3 mg/kg, i.p) for 6 h. Lung, liver, colon, and kidney tissues were harvested to measure the Ptx3 protein levels (Ptx3fl/fl, n = 1 and Ptx3fl/fl; Ubc-Cre, n = 1). C The experimental design for the in vivo tumor growth of MC38 by latter knockout of Ptx3 in conditional knockout mice (Ptx3fl/fl, n = 4 and Ptx3fl/fl; Ubc-Cre, n = 6). Tamoxifen was given 5 days after MC38 cell inoculation, and D the plasma Ptx3 level was measured and E tumor growth curves were generated. F, G Illustration and growth curves of subcutaneous tumors formed from 5 × 10⁴ MC38 cells (n = 5), 1 × 10⁵ MEFs (n = 3), or 5 × 10⁴ MC38 cells mixed with 1 × 10⁵ MEFs (n = 5) in C57BL/6 mice. H, I Intracellular and secretory Ptx3 protein levels in shVoid, shPtx3#915, and shPtx3#916 MEFs. Conditioned medium was harvested for ELISA assay (n = 3). J The growth curves of subcutaneous tumors formed from MC38 cells (n = 5) and MC38 cells mixed with MEFs-shVoid (n = 6), -shPtx3#915 (n = 6), or -shPtx3#916 (n = 6). K–M Illustration and growth curves of subcutaneous tumors in the MC38 cell/MEF tumor model. Intratumoral administration of IgG1κ (n = 4) or WHC-001 (αPTX3 Ab, n = 4) (100 μg) was performed every 3 days for a total of 4 treatments beginning when the tumor volume reached to 80 mm3. Tumor volume (mm3) = (L × W2)/2. p values were calculated by two-tailed unpaired Student’s t test or one-way ANOVA. *represents a p value of < 0.05. **represents a p value of < 0.01. ***represents a p value of < 0.01. Values on the plots are presented as the means ± SEMs

