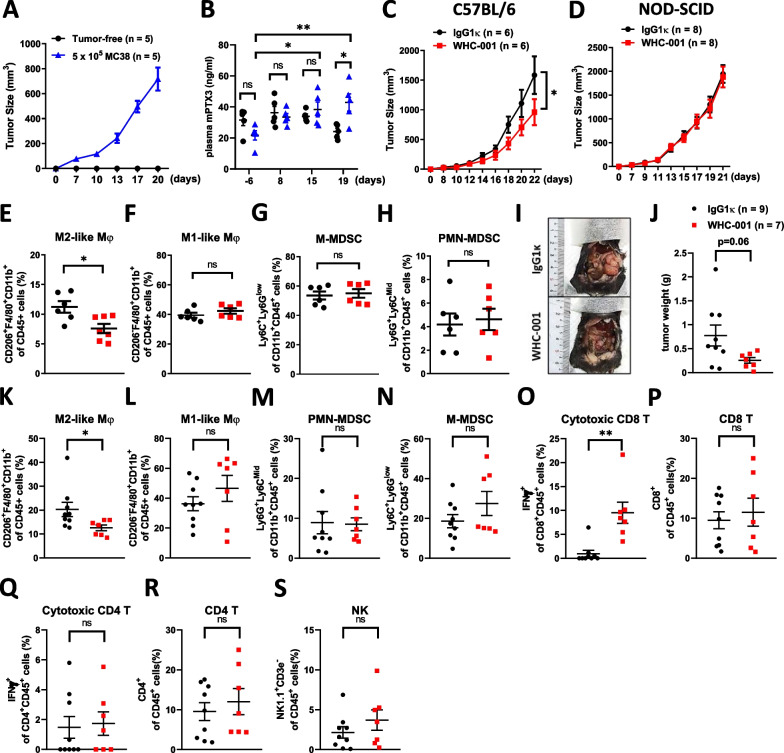
Fig. 4.
Blockade of PTX3 reduces tumor growth and the population of tumor-infiltrating M2-like macrophages and increases the population of tumor-infiltrating cytotoxic CD8 + T cells. A The tumor growth curves and B plasma Ptx3 levels in MC38 tumor-bearing mice (n = 5) and tumor-free mice (n = 5). C The growth curves of subcutaneous MC38 tumors in immunocompetent mice (C57BL/6) following i.p. administration of IgG1κ (n = 6) or WHC-001 (αPTX3 Ab, n = 6) (10 mg/kg) every 4 days for a total of 3 treatments. D The growth curves of subcutaneous MC38 tumors in immunodeficient mice (NOD-SCID) following i.p. administration of IgG1κ (n = 8) or WHC-001 (αPTX3 Ab, n = 8) (10 mg/kg) every 4 days for a total of 3 treatments. Tumor volume (mm3) = (L × W2)/2. E–H Tumor-infiltrating immune populations of MC38 tumors in Fig. 4C were analyzed by flow cytometry. The CD45 positive immune cells were gated on PMN-MDSCs (Ly6G + Ly6CMid/CD11b+), M-MDSCs (Ly6C + Ly6Clow/CD11b +), M1-like macrophages (CD11b + F4/80 + CD206−), and M2-like macrophages (CD11b + F4/80 + CD206 +). I The orthotopic colon tumors formed from 1 × 10⁶ MC38 cells in the cecal wall following i.p. administration of IgG1κ (n = 9) or WHC-001 (αPTX3 Ab, n = 7) (10 mg/kg) beginning on the 7th day post tumor cell inoculation and repeated every 4 days for a total of 3 treatments. J The tumor weights and K–S tumor-infiltrating immune populations of MC38 tumors in Fig. 4J are shown. The CD45 positive immune cells were gated on CD8 + T cells (CD8 +), CD4 + T cells (CD4 +), cytotoxic CD8 + T cells (IFNγ + CD8 +), NK cells (NK 1.1 + CD3e−), PMN-MDSCs (Ly6G + Ly6CMid/CD11b +), M-MDSCs (Ly6C + Ly6Clow/CD11b +), M1-like macrophages (CD11b + F4/80 + CD206−), and M2-like macrophages (CD11b + F4/80 + CD206 +). p values were calculated by two-tailed unpaired Student’s t test, one-way ANOVA, or two-way ANOVA. *represents a p value of < 0.05. ns represents nonsignificant differences, *represents a p value of < 0.05, and **represents a p value of < 0.01. Values on the plots are presented as the means ± SEMs

