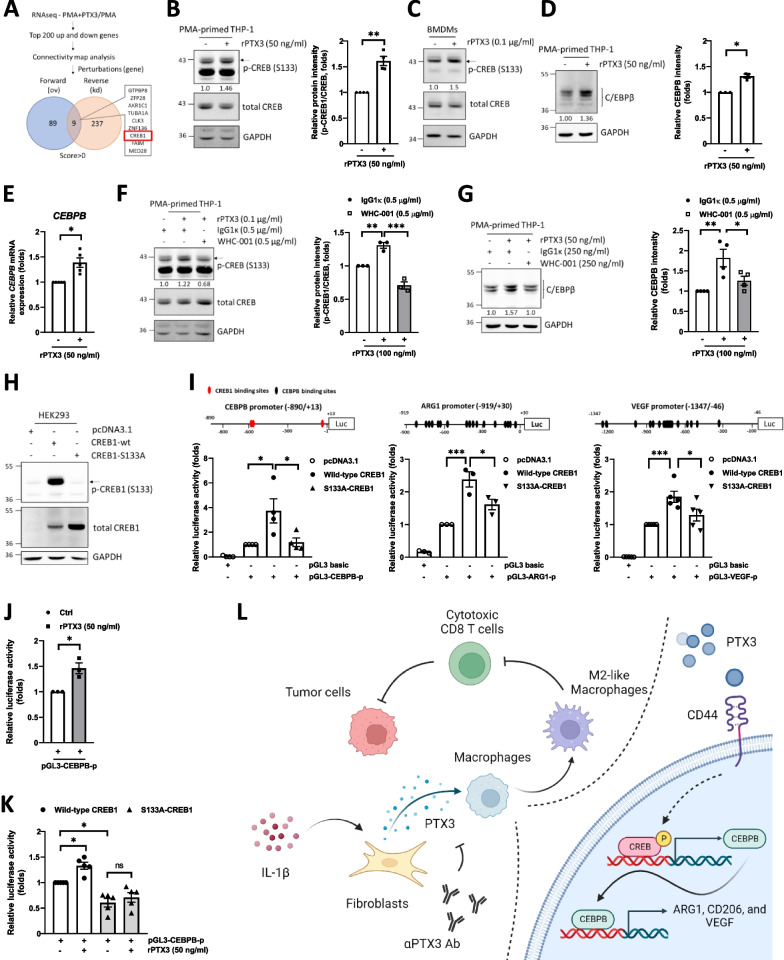
Fig. 6.
PTX3 contributes to M2 polarization through activation of CREB1 signaling. A RNA sequencing was performed in unstimulated THP-1 macrophages and PTX3-stimulated THP-1 macrophages. The top 200 upregulated and downregulated genes were selected for Connectivity Map analysis. Forward (overexpression) and reverse (knockdown) perturbation candidate genes were identified. B Western blot analysis of p-CREB1 and CREB1 in THP-1 macrophages treated with or without 50 ng/ml PTX3. C Western blot analysis of p-CREB1 and CREB1 in BMDM streated with or without 100 ng/ml PTX3. D The protein level and E mRNA level of CEBPB in THP-1 macrophages treated with or without 50 ng/ml PTX3. F, G The protein levels of p-CREB1, CREB1, and CEBPB in THP-1 macrophages treated with 100 ng/ml PTX3 plus either 500 ng/ml IgG1κ or WHC-001 (αPTX3Ab). H Western blot analysis of p-CREB1 and CREB1 in HEK293 cells transiently transfected with pcDNA3.1, CREB1-wt, or CREB1-S133A. I Illustration of the luciferase promoter constructs of CEBPB (− 890/ + 13), VEGF (− 1347/− 46), and ARG1 (− 919/ + 30). The CREB1 binding site is indicated in red and the CEBPB binding site is indicated in black. The promoter activity of the pGL3-CEBPB (− 890/ + 13), pGL3-VEGF (− 1347/− 46), and pGL3-ARG1 (− 919/ + 30) constructs in HEK293 cells cotransfected with pcDNA3.1, CREB1-wt, or CREB1-S133A is shown. J The promoter activity of pGL3-CEBPB (− 890/ + 13) in THP-1 macrophages treated with or without 50 ng/ml PTX3. K The promoter activity of pGL3-CEBPB (− 890/ + 13) in THP-1 macrophages cotransfected with CREB1-wt or CREB1-S133A following treatment with or without 50 ng/ml PTX3. L Schematic model showing that PTX3 contributes to stroma-mediated immunosuppression by promoting M2-like macrophage polarization through activation of the CEBPB/CREB1 axis in colon cancer. p values were calculated by two-tailed paired Student’s t test or one-way ANOVA. ns represents nonsignificant difference, *represents a p value of < 0.05, **represents a p value of < 0.01, and ***represents a p value of < 0.001. Values on the plots are presented as the means ± SEMs. Data are combined from 3 to 5 independent experiments

