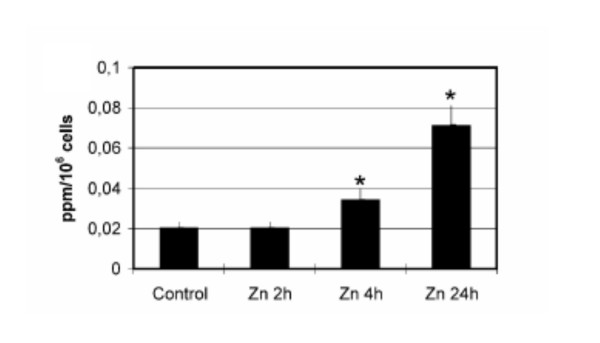
Figure 4.
Accumulation of Zn in HepG2 cells. Zn levels in HepG2 cells exposed to 50 μg/ml ZnS04 7H20 for the time indicated and measured by ICP-AES. Data (ppm/106 cells) represent the mean of at least three replica with the standard deviation. *Significantly different from the control with the Kruskall-Wallis test (p ≤ 0.05).

