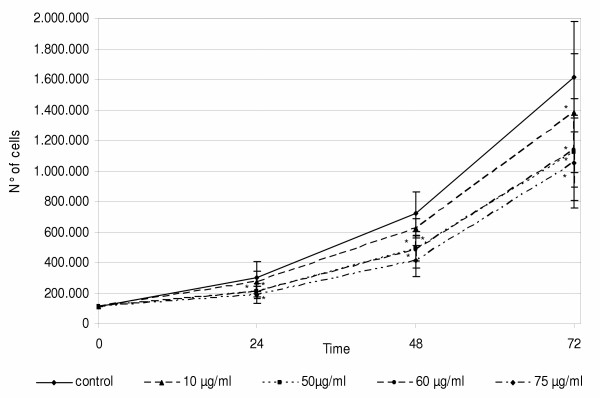
Figure 6.
A549 cell proliferation. Cell growth curves at 24, 48 and 72 h after TD organic extract treatment at the doses indicated. A decrease of cell proliferation capability is evident, and it is time and dose dependent. Differences between control and treated samples are marked with * (p ≤ 0.05).

