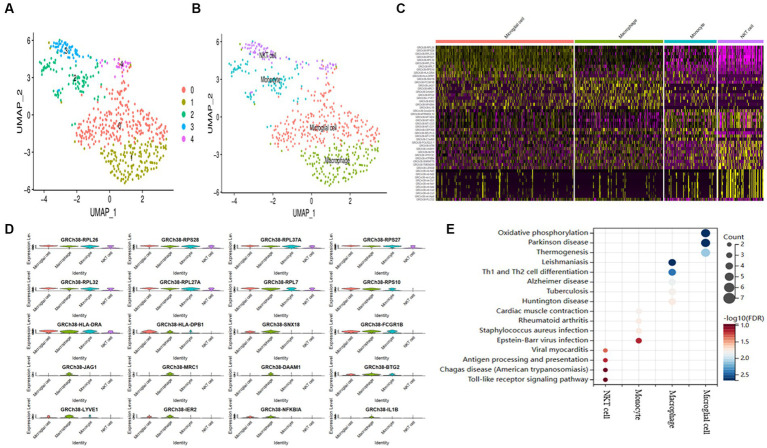
Figure 1.
AD samples of single-cell sequencing. (A) T-SNE plots of different subpopulations of 5 cell clusters. (B) The maker genes identify four cell types. (C) Heatmap showing the top 10 genes in 4 expressed cell types. (D) Expression of the top gene in different cell types. (E) Examining the KEGG enrichment of the four cell types.

