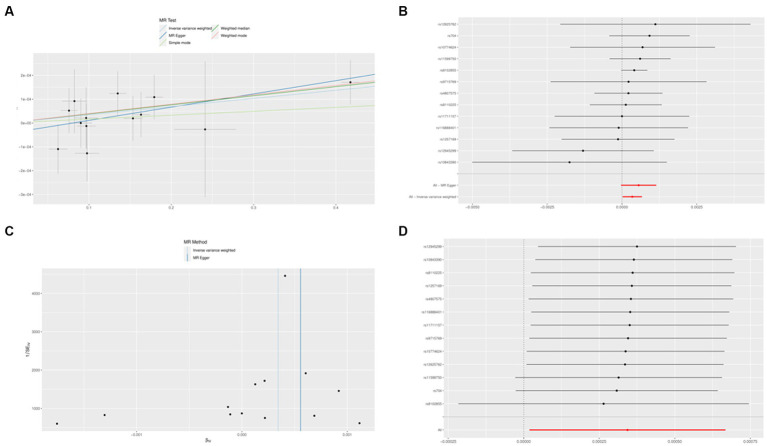
Figure 8.
The Mendelian randomization experiment results. (A) A scatterplot demonstrating how IL1B raises the likelihood of AD. (B) A forest plot showing the causal relationship between each SNP and the risk of AD. (C) A funnel plot shows the overall variability of the MR assessments of the effect of IL1B on AD. (D) A leave-one-out figure showing how IL1B and the risk of AD are related causally.

