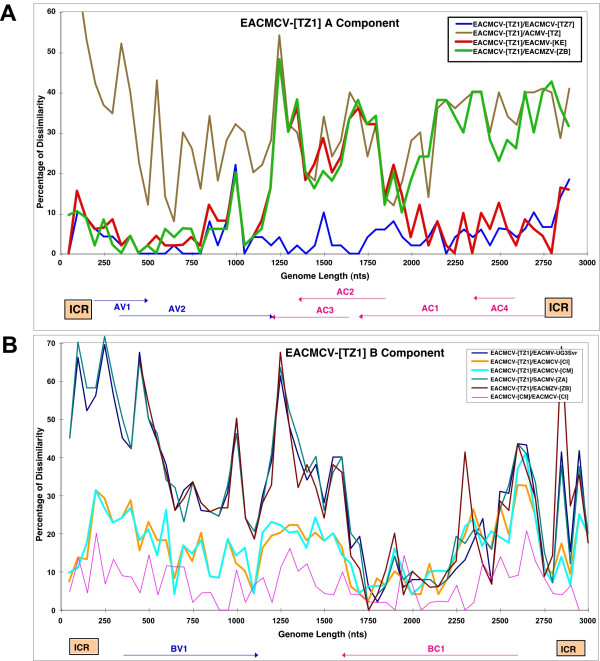
Figure 8.
Pairwise sequence comparisons of EACMCV-[TZ1, TZ7] DNA-A (A) and DNA-B (B). Each curve represents a sequence comparison along the linearized virus genomes of a chosen pair of viruses. The correspondance for each colored curve is given in the figure. The dissimilarity index (Y axis) is the percentage of dissimilarity over a window of 50 nucleotides. The curves under 10% represent a pair of isolates of the same species and curves above 10% represent a pair of isolates belonging to different species. A switch between the two types of curves represents a putative recombination between the two viruses or their ancestors. The linearized genome organization of each component is depicted at the bottom.

