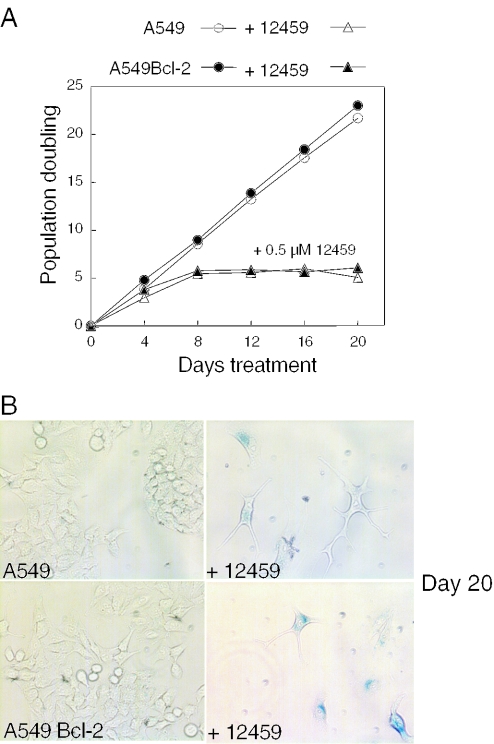
Figure 6.
(a) Long-term proliferation curve of A549 or A549::Bcl-2 cells in the absence (open and closed circles, respectively) or presence of 12459 (0.5 μM) (open and closed triangles, respectively). A cell growth plateau appears at day 8 and cells enter senescence at day 20 for both 12459-treated cell lines at a population doubling equal to 5. (b) Expression of SA β-galactosidase activity in untreated A549 or A549::Bcl-2 cells (A549, A549Bcl-2) or in cells treated with 0.5 μM 12459 (+ 12459) for 20 days.

