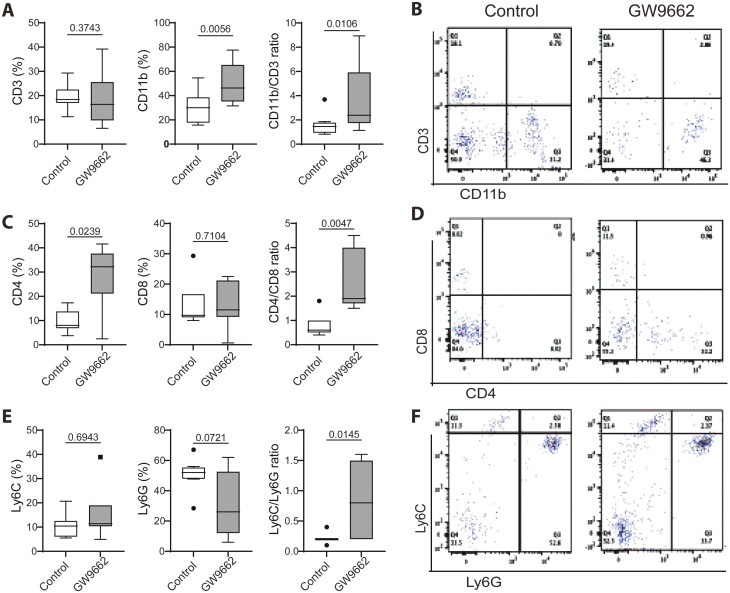
Figure 5.
FACS analysis of blood in 25-month-old female C57BL/6 mice treated without or with GW9662 for 3 weeks. The experiment was performed as described in Figure 4. Values are given as mean ± SD; n = 9–10 mice per group. Unpaired t test and p values are indicated. Symbols (dots and squares, included in data set) denote outliers.

