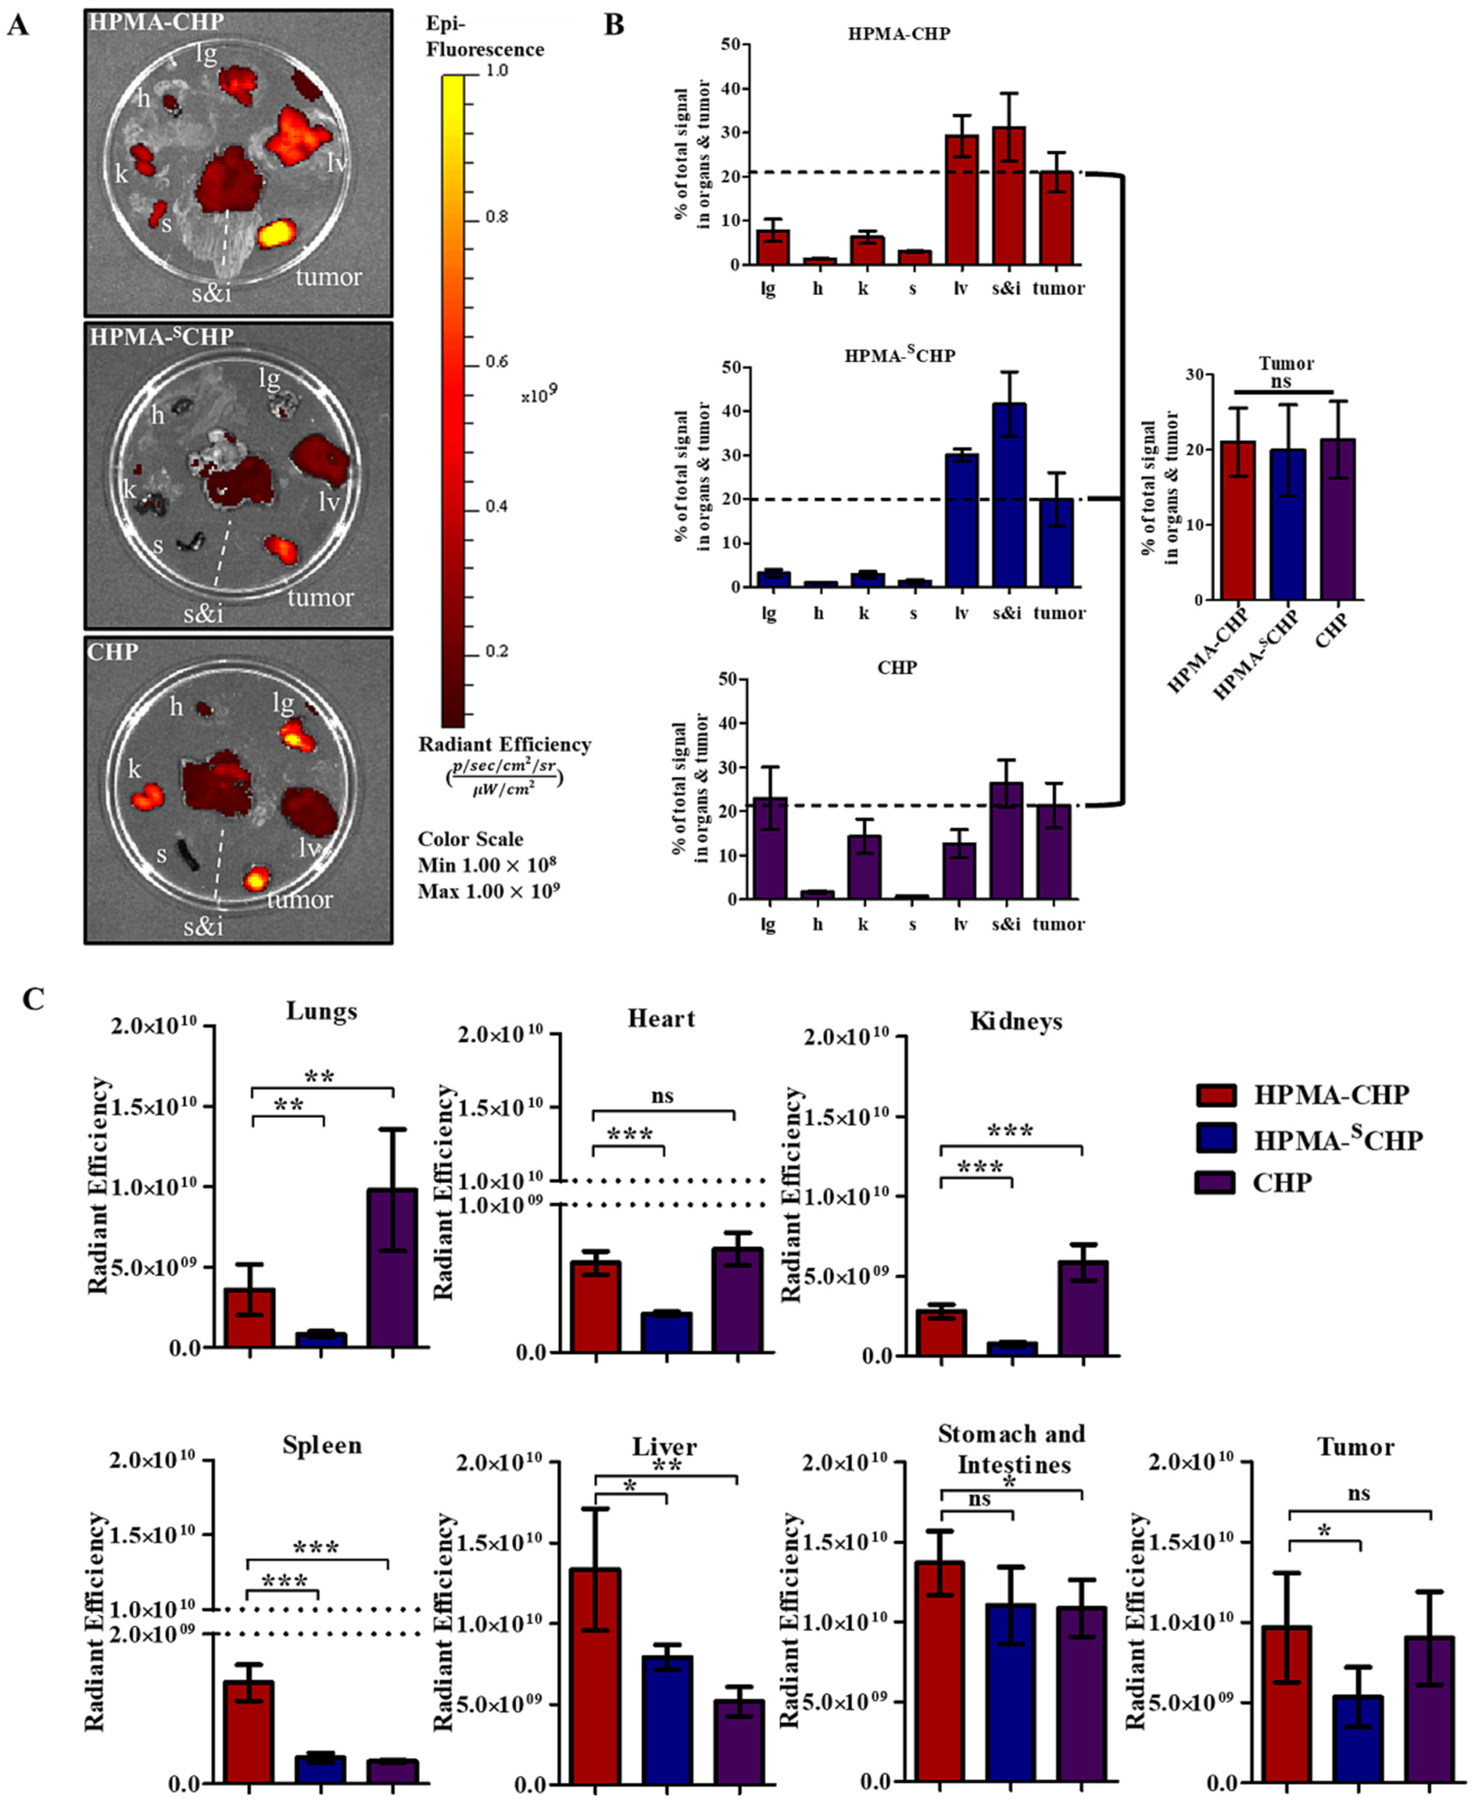
Fig. 8.

(A) Fluorescence images of harvested lung (lg), heart (h), liver (lv), kidneys (k), spleen (s), stomach and intestines (s&i), and breast tumor (tumor) from mice 168 h after tail-vein injection of Cy5.5-labeled HPMA-CHP, HPMA-SCHP, or CHP, (B) percent of signal in each organ or tumor out of total signal in organs and tumor at 168 h, with comparison between percentage in tumors between the three groups, and (C) fluorescent signal in radiant efficiency units in each organ or tumor in HPMA-CHP, HPMA-SCHP, and CHP. (Mean ± SD, N = 5, *p < 0.05, **p < 0.01, ***p < 0.001).
