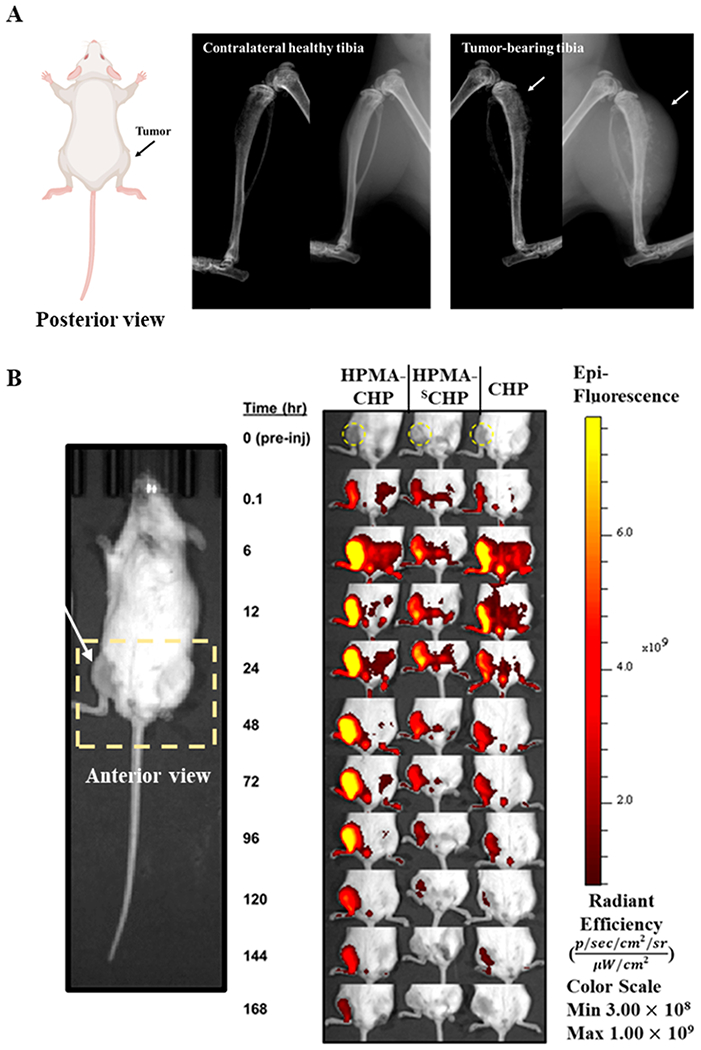
Figure 3.

(A) X-ray images of contralateral and tumor-bearing tibias of osteosarcoma tumor-bearing NSG mice, implanted with Saos-2 cells in the right proximal tibia, each showing the bone alone in the left image and the soft tissue along with the bone in the right image; arrows indicate the tumor site; (B) fluorescence images at t = 0 (preinjection), 0.1 (immediately postinjection), 6, 12, 24, 48, 72, 96, 120, 144, and 168 h of intravenously administered HPMA–CHP, HPMA–SCHP, and CHP, with tumor region indicated by the yellow dashed circle in t = 0 preinjection time point image and the rectangular dashed box indicates the cropped region shown in the time point data with the arrow indicating tumor.
