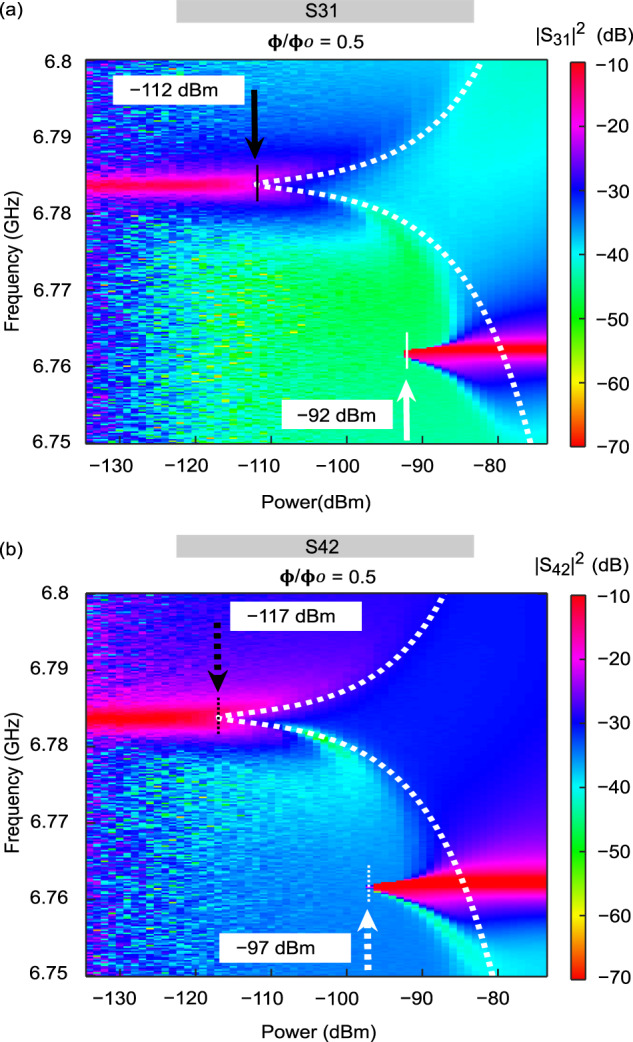
Fig. 4. Measured transmission coefficient of the device as a function of the injected microwave power and frequency.

a Transmission coefficient ∣S31∣2. b Transmission coefficient ∣S42∣2. The color bars represent the transmission amplitude in dB. The dotted lines are the theoretically expected positions of the peak maxima given by Eq. (2). The observed maximum difference between the background transmission (without background calibration) is less than 10%, and can be considered as an error bar. See Background calibration under Section II for error analysis.
