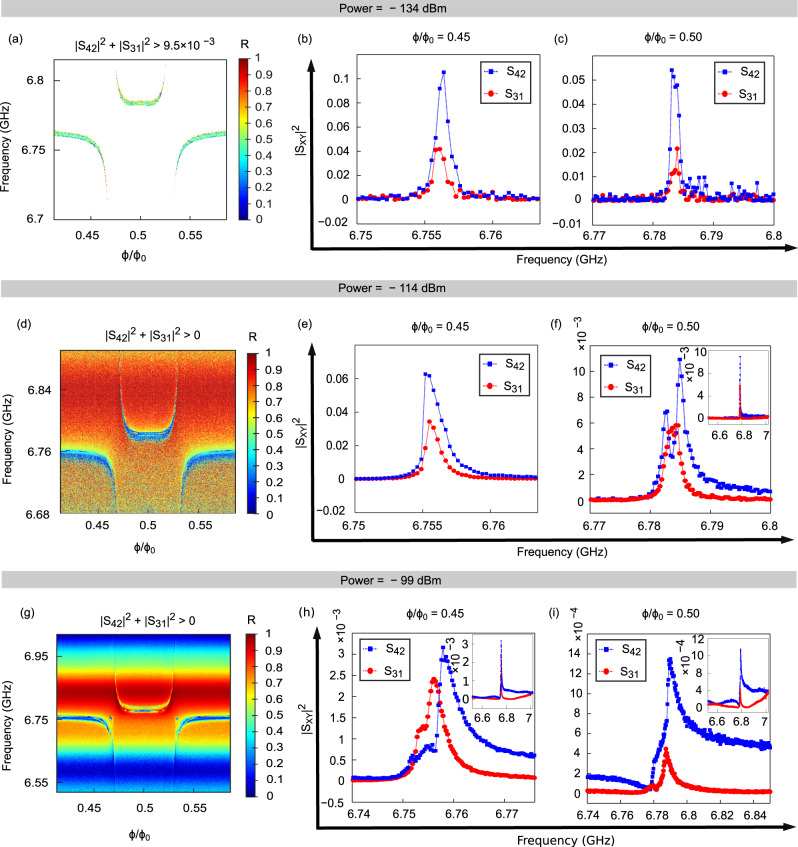
Fig. 5. Data analysis for estimation of the transmission rectification ratio R.
a, d, g R of Eq. (1) measured at three different levels of the injected microwave power (P), −134 dBm, −114 dBm and −99 dBm. The color bar in (a, d, g) is the rectification ratio R. Here, Φ is the external magnetic flux and Φ0( = h/2e) is the magnetic flux quantum. At low input power −134 dBm, see panel a, the SNR is relatively poor. Here we extract the data points where the sum ∣S42∣2 + ∣S31∣2 exceeds certain threshold value. This threshold value is provided in the label above the graphs. In this way we avoid errors emerging from the background noise that could contribute to R at low input power. (b, e, h) Transmission coefficient ∣S31∣2 and ∣S42∣2 for the same three levels of power and at the flux value Φ/Φ0 = 0.45. c, f, i Transmission coefficient ∣S31∣2 and ∣S42∣2 at the flux value Φ/Φ0 = 0.5. The insets in (f, h, i are the plots with large x-axis from 6.52 to 7.02 GHz, of their main figures. The insertion loss and the isolation are reported in table I. Error bars for (a–c) are ± 35%, whereas for (d–i) the error bars are below ± 10%. For more details on error estimation see error analysis under Section II.

