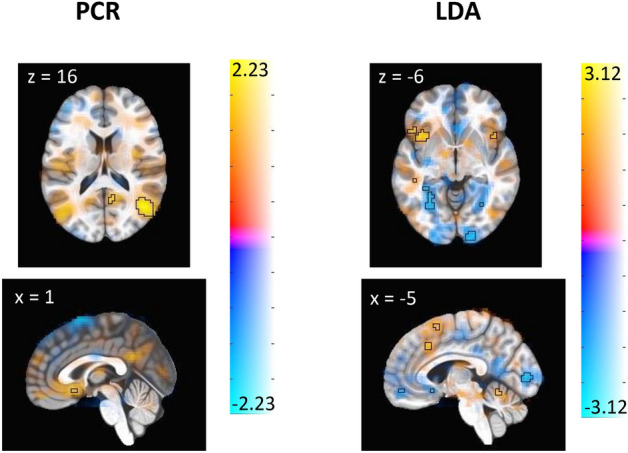
Figure 4.

Thresholded display of emotion regulation signature. These images display brain regions which contribute most consistently to the identification of emotion regulation. Color shows the average contribution of each voxel to the prediction of emotion regulation, with warm color regions depicting positive associations and cool color regions depicting negative associations. Outlined regions display the voxels whose contributions are significant at the adjusted p < 0.005 threshold for LASSO PCR (left panel) and LDA (right panel). Note that slice location is not uniform between panels.
