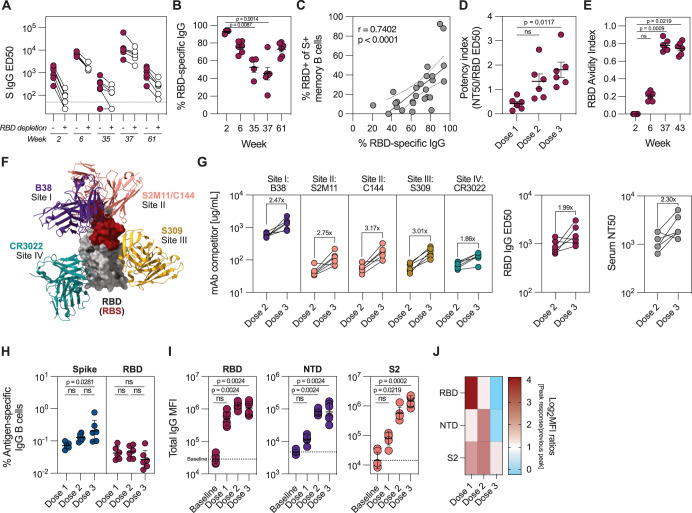
Fig. 4. Expansion of non-RBD-specific B cell responses following boost immunizations.
WA-1 Spike-binding IgG titers in plasma before and after depletion of RBD-binding antibodies (A), and proportion of RBD-binding antibodies at different timepoints (B) (n = 6). C Correlation between proportion of RBD-specific IgG antibodies and RBD-specific MBCs in the blood (n = 6). D Neutralization potency index, defined as the ratio between WA-1 neutralizing and RBD-binding antibody titers 2 weeks after each immunization (n = 6). E Avidity index of RBD-binding IgG antibodies at different timepoints (n = 6), determined by chaotropic wash ELISA with 2 M NaSCN as the chaotropic reagent. F Schematic of RBD with representative antibodies for four defined binding classes (PDB IDs 7K90 (RBD + C144 mAb), 7BZ5 (B38 mAb), 6WPS (S309 mAb), 6W41 (CR3022 mAb)). Receptor binding site (RBS) is labeled in red. G Relative serum reactivity to each of the four defined RBD-binding antibody classes (site I-site IV, n = 6), determined through ELISA competition assay using biotinylated monoclonal antibodies listed in (F). Total RBD-binding IgG and neutralization titers are shown on the right. Dose 2 and 3 represent timepoints 4 weeks after each immunization. H Frequency of Spike- and RBD-specific MBCs 2 weeks after each immunization (n = 6). Binding to different Spike subdomains (RBD, NTD, or S2) at selected timepoints, measured by multiplexed Luminex bead-based assay (n = 6) (I) and the fold changes in the binding titers from timepoint to timepoint (Dose 1 = week 2/week 0, Dose 2 = week 6/week 2, Dose 3 = week 37/week 6) (J). Data is presented as mean ± SEM (B, D, E) or geometric mean ± geometric SD (H, I). Statistical analysis was performed using Kruskal-Wallis test with Dunn’s post hoc correction (B), Spearman correlation (C) or Friedman’s test with Dunn’s post hoc correction (D, E, H, I). Baseline refers to week 0, dose 1, dose 2 and dose 3 refer to 2 weeks after each immunization in all panels except in (G). Dotted line corresponds to lower level of detection (A), fold change = 1 (D, H). or the baseline signal at week 0 (I).

