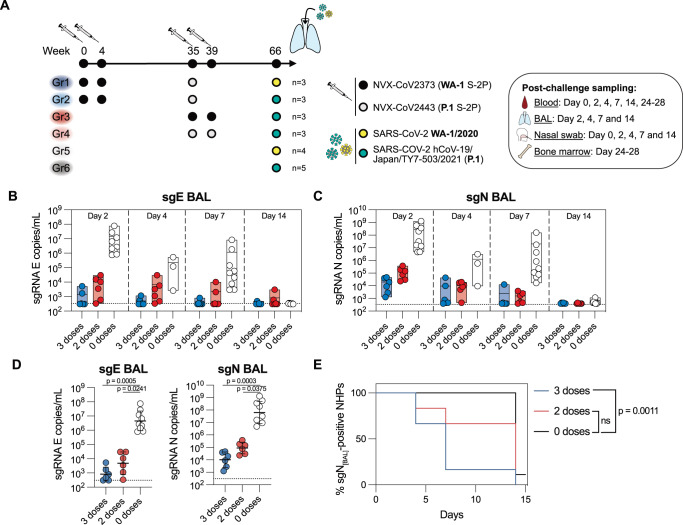
Fig. 6. Durable protection induced by Novavax’s COVID-19 vaccine.
A Study design and sampling schedule of the SARS-CoV-2 challenge experiment. Viral loads in BAL assessed by subgenomic (sg)E (B) and sgN gene-targeted RT-qPCR (C) (n = 6-9 per group). D Peak sgE and sgN loads in BAL during the 14 day follow-up after challenge (n = 6–9 per group). E Kaplan-Meier survival analysis, used to evaluate the time required for the animals in different groups to fully supress viral replication (sgN copies/mL < lower level of detection) (n = 6–9 per group). Data is presented as mean (min-max) (B, C) or geometric mean ± geometric SD (D). Statistical analysis was performed using Kruskal-Wallis test with Dunn’s post hoc correction (D) or log-rank Mantel-Cox test with Bonferroni correction. Dotted line corresponds to lower level of detection (B–D).

