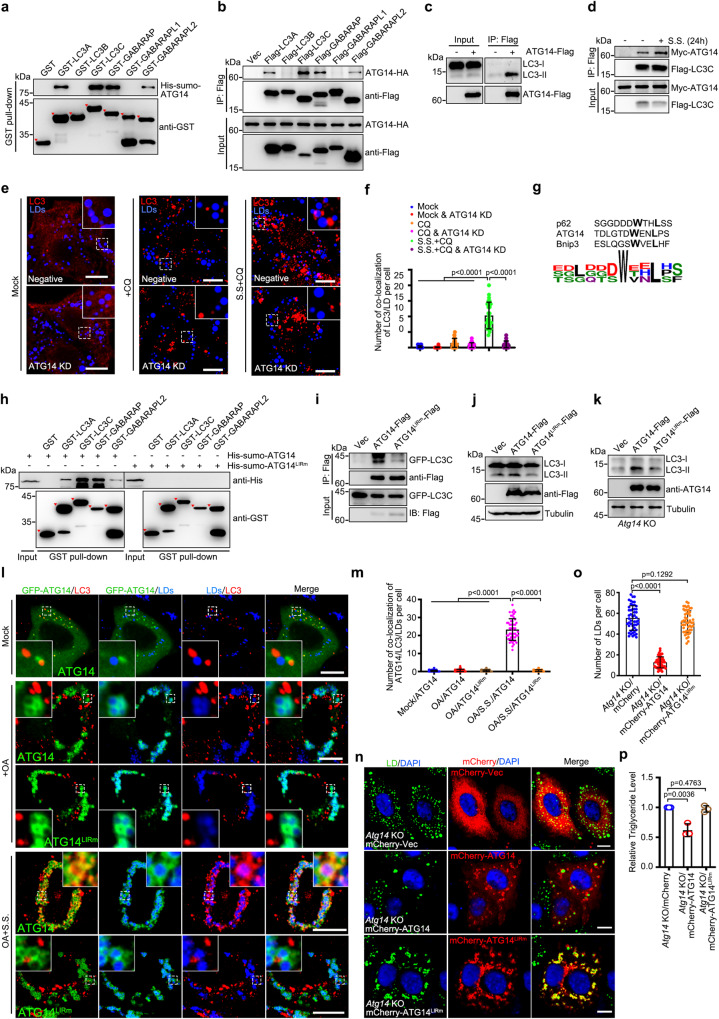
Fig. 2. ATG14 acts as a lipophagic receptor.
a GST pull-down analysis of GST-ATG8s with His-sumo-ATG14. b Co-immunoprecipitation analysis of Flag-ATG8s with ATG14-HA. c Co-immunoprecipitation analysis of ATG14-Flag with endogenous LC3. d The effect of serum starvation (S.S.) on Myc-ATG14 and Flag-LC3C interaction was analyzed by co-immunoprecipitation. e, f Co-localization of LDs with endogenous LC3 in indicated treated cells. Wile-type or ATG14 KD HeLa cells were treated with 200 μM OA for 12 h, and meanwhile, with or without S.S. for 24 h, with or without 100 μM CQ for 6 h before cells were fixed. The number of colocalization of LC3 with LDs per cell was counted from 25 cells of three independent experiments. g Schematic diagram of LIR (WxxL) in p62, ATG14, and Bnip3. h GST pull-down analysis of GST-ATG8s with His-sumo-ATG14 or LIR mutant. i Co-immunoprecipitation analysis of ATG14-Flag or LIR mutant with GFP-LC3C. j, k HEK293T cells were transfected with indicated plasmids for 36 h (j), Atg14 knockout HeLa cells were transfected with indicated plasmids for 24 h (k). Cell lysates were analyzed via western blot. l, m Co-localization of LDs, GFP-ATG14, and endogenous LC3. HeLa cells were treated with or without 200 μM OA for 12 h and treated with or without S.S. for 24 h. Meanwhile, 100 μM CQ was added for 6 h before cells were fixed. The number of colocalization of ATG14/LC3/LDs per cell was counted from 50 cells of three independent experiments. n, o Atg14 knockout HeLa cells were transfected with indicated plasmids for 24 h, and treated with 200 μM OA for 6 h. Cells were imaged by confocal microscopy. Number of LDs was counted from 50 cells in three independent experiments. p The concentration of triglyceride in Atg14 knockout HeLa cells of three independent experiments was analyzed according to manufacturer’s instructions. Data information: Scar bar represents 10 μm for all fluorescence images. Error bars, mean ± SD of three independent experiments. Two-tailed Unpaired Student’s t test. Source data are provided as a Source Data file.

