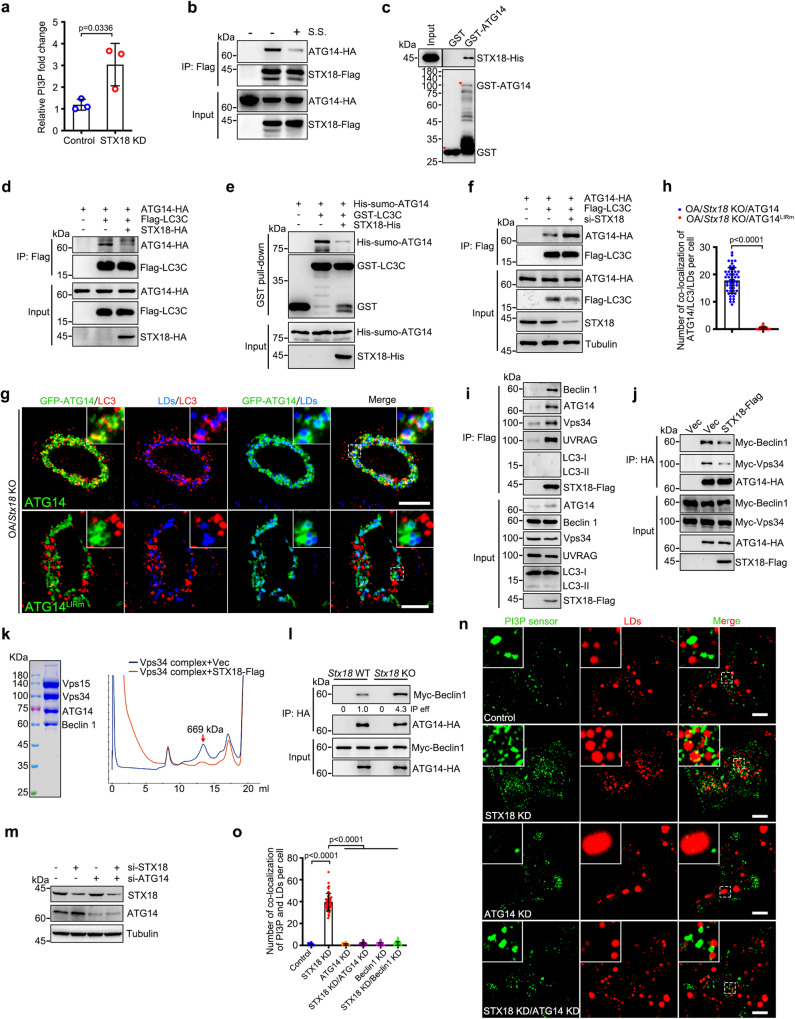
Fig. 3. STX18 negatively regulates the interactions of ATG14-ATG8s and the formation of PI3KC3-C1 complex.
a PI(3)P production was analyzed by the ELISA assay. The fold change was calculated based on the concentration of PI(3)P and normalized against control group. b The effect of serum starvation (S.S.) on STX18-Flag and ATG14-HA interaction was analyzed by co-immunoprecipitation. c GST pull-down analysis of GST-ATG14 with STX18-His. d The effect of STX18-HA expression on the interaction of Flag-LC3C with ATG14-HA was analyzed by immunoprecipitation. e The effect of STX18 on the interaction of LC3C with ATG14 was detected by GST pull-down. f The effect of STX18 knockdown on the interaction of Flag-LC3C with ATG14-HA was analyzed by immunoprecipitation. g, h Co-localization of GFP-ATG14/LC3/LDs in Stx18 knockout HeLa cells expressing indicated plasmids were treated with 200 μM OA for 12 h. 100 μM CQ was added for 6 h before cells were fixed. The number of colocalization of ATG14/LC3/LDs per cell was counted from 50 cells of three independent experiments. i HEK293T cells were transfected with STX18-Flag. Protein interactions were detected by immunoprecipitation with anti-Flag beads and immunoblotting analysis. j The effect of STX18-Flag expression on the interaction of ATG14-HA with Myc-Vps34 and Myc-Beclin1 was analyzed by immunoprecipitation. k Vps34 complex (Vps15, Vps34, ATG14, Beclin1) was purified from 293 F cells and incubated with or without STX18-Flag and analyzed via Chromatography of C1 on Superose 6 10/300 GL columns. l HEK293T Stx18 wild-type and knockout cells were transfected with indicated plasmids. Protein interactions were detected by immunoprecipitation. m HeLa cells were transfected with ATG14 or/and STX18 siRNA for 48 h. Cell lysis were analyzed via western blot. n, o HeLa cells expressing GFP-FYVESARA were transfected with ATG14 or/and STX18 siRNA for 48 h, and treated with 200 μM OA for 12 h. Co-localization of LDs and GFP-FYVESARA. The number of colocalization of PI3P with LDs per cell in (n and Supplementary Fig. 4j) was counted from 50 cells of three independent experiments. Data information: Scar bar represents 10 μm for all fluorescence images. Error bars, mean ± SD of three independent experiments. Two-tailed Unpaired Student’s t test. Source data are provided as a Source Data file.

